Hi Traders! Arvinth here from Traders Academy Club team. Weekly summary and review May 27th, 2022 is here. It is now time to recap and summarize the trade setups that we had during this week. Below you will find the short explanation of all the trade setups we had this week and how it has currently developed now.
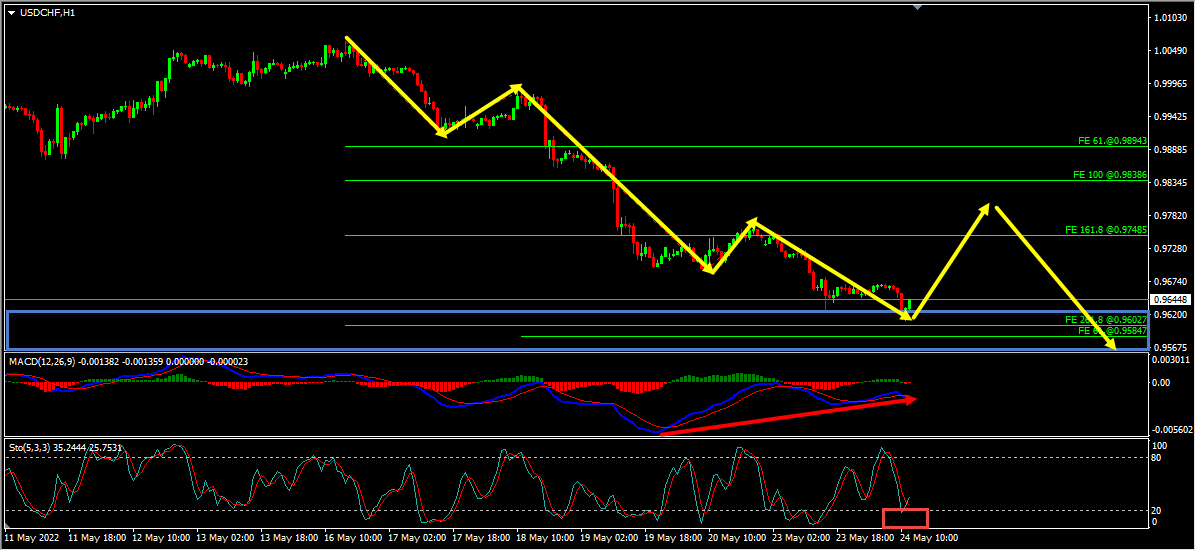
USDCHF – My idea here was “Looking at the H1 chart, we could see that the price which was moving lower has created a bearish trend pattern in the form of three lower highs, lower lows which we may consider as evidence of bearish pressure. Generally, after a bearish trend pattern, we may expect corrections and then further continuation lower. Also, while measuring the first two waves of this bearish trend pattern using the Fibonacci expansion tool we have a key support zone that has formed based on the 261.8%(0.96027) Fibonacci expansion level of the first wave and the 61.8%(0.95847) Fibonacci expansion level of the second wave. Price has currently reached this key support zone and in addition to this, we have a bullish divergence that has formed between the first low that has formed at 0.96968 and the second current low that has formed at 0.96102 based on the MACD indicator which we may consider as evidence of bullish pressure. Also, based on the Stochastic Oscillator we could see that the price has reached its extreme which we may consider as another evidence favoring the short term bullish view. So based on all this, my short expectation is bullish and my mid term expectation is bearish here”.
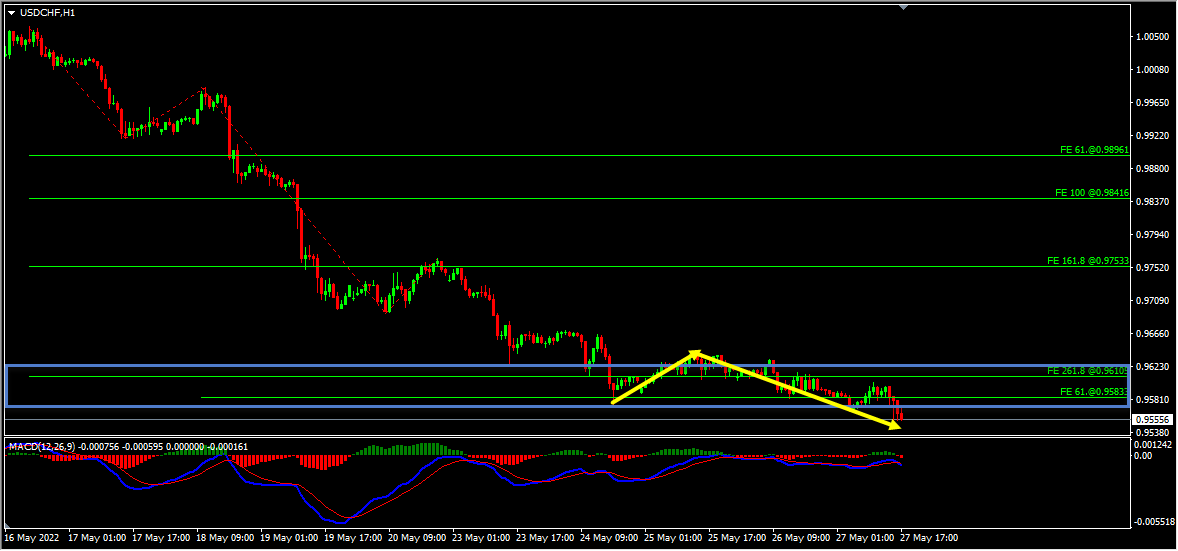
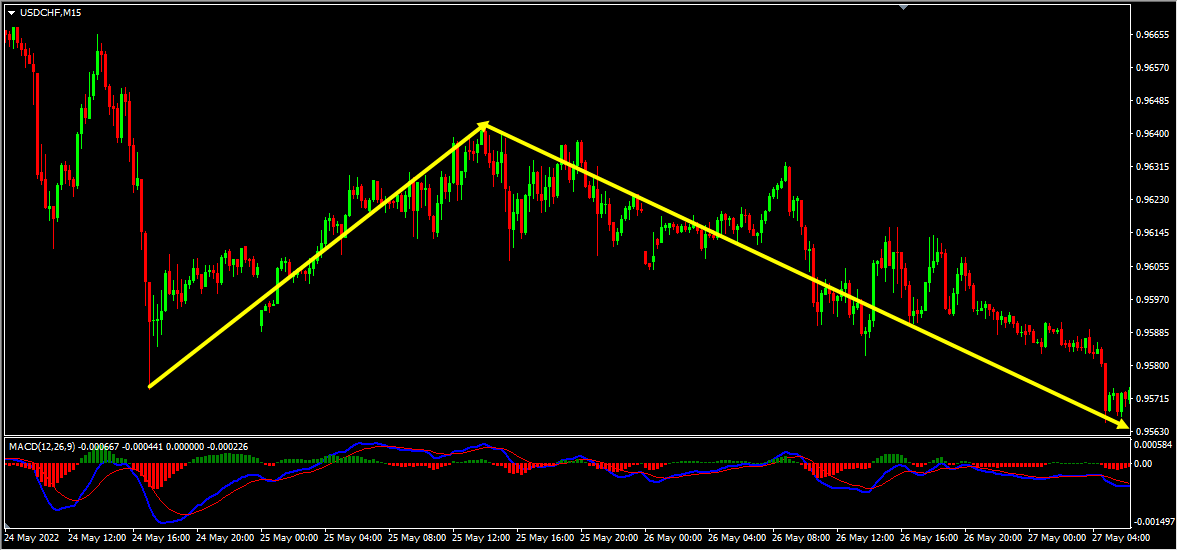
Current Scenario – In this pair based on the above-mentioned analysis my short term view was bullish and my mid term view was bearish. The price action followed my analysis here as I expected it to, the short term bullish move happened from the key support zone and delivered around 70 pips move. The price then moved lower further as I expected it to and has delivered around 100 pips move so far.
You can see this move clearly on the M15 chart below.
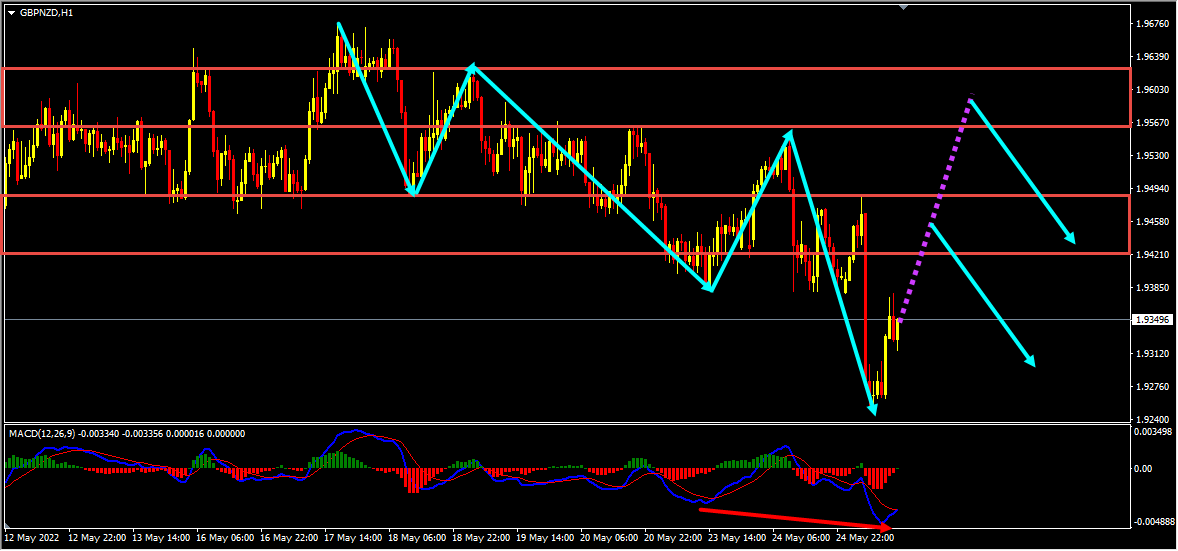
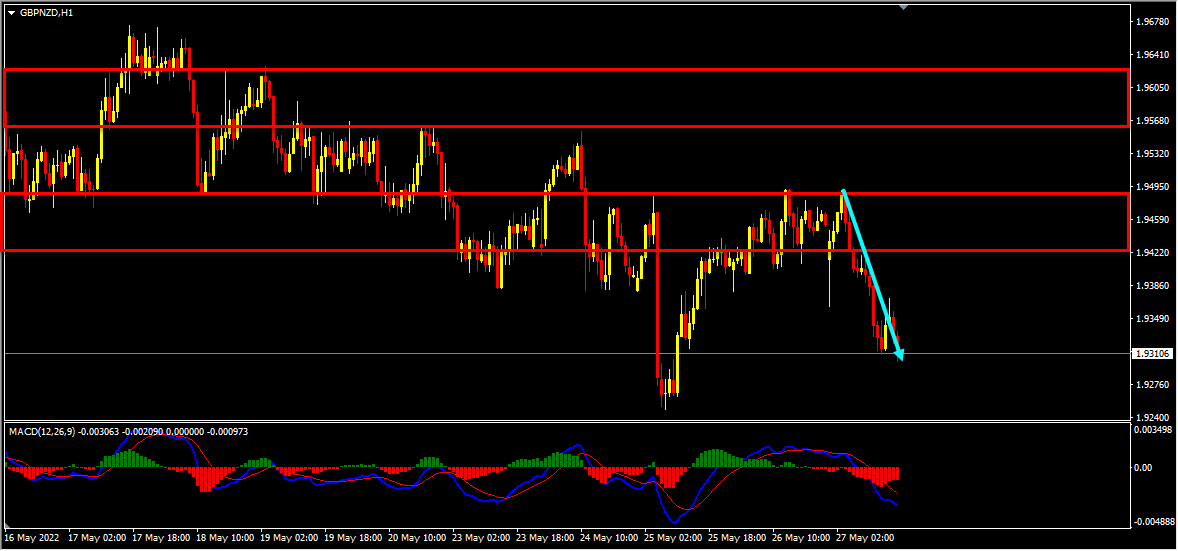
GBPNZD – My idea here was “On the H1 chart, the price which is moving lower has created a bearish trend pattern in the form of three lower highs, lower lows which we may consider as evidence of bearish pressure. Generally, after a bearish trend pattern, we may expect corrections and then further continuation lower. Currently it looks like a correction is happening. In addition to this, the price has created lower lows based on the MACD indicator which is a sign of gaining momentum towards the bearish side. Also, we had two strong support zones that has formed and the price which is moving lower has broken below these zones and is holding below them, we may consider this as yet another evidence of bearish pressure. Currently, these strong support zones are acting as strong resistance zones for us. Until these two strong resistance zones (marked in red) hold my view remains bearish here and I expect the price to move lower further”.
Current Scenario – In GBPNZD, my short term view was bearish and I was expecting the price to move lower further until the two strong resistance zones hold. After the bearish trend pattern the price which was moving higher reached the first strong resistance zone, respected it and then the price moved lower and delivered around 200 pips move so far!
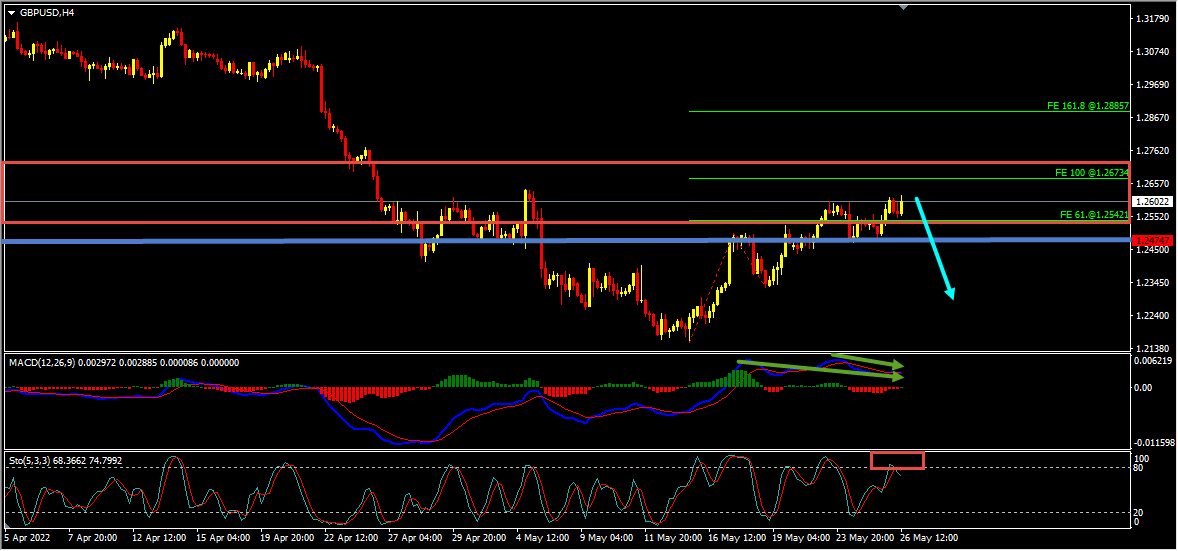
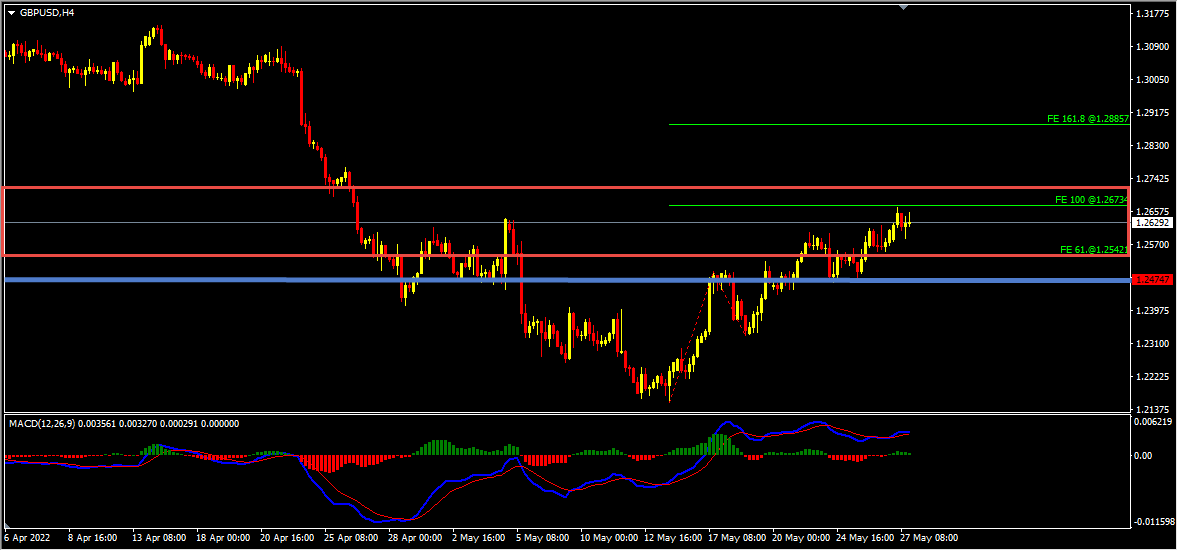
GBPUSD – My idea here was “On the H4 chart, the price which is moving higher has currently reached a key resistance zone that has formed based on the 61.8%(1.25421) and 100%(1.26734) Fibonacci expansion levels of the first wave. Also, we have a bearish divergence that has formed between the first high that has formed at 1.25009 and the second high that has formed at 1.26206 based on the MACD indicator which we may consider as evidence of bearish pressure. In addition to this, based on the Stochastic Oscillator we could see that the price has reached its extreme here as well which we may consider as yet another evidence of bearish pressure. So everything looks good here for the bears. If we get a valid breakout below the low at 1.24747 we may then consider it as a validation for this short term bearish view and may expect the price to move lower further”.
Current Scenario – In this pair my short term view was bearish and I mentioned that “If the price breaks below the low at 1.24747 we may then consider it as a validation for this short term bearish view and may expect the price to move lower further”. The validation for the short term bearish view which is a valid breakout below the low at 1.24747 didn’t happen here yet and the price is currently holding in the key resistance zone. My plan still remains the same here.
Note: You can follow us here on Trading View and also on our blog to get similar ideas on daily basis)
For similar trade ideas and much more I invite you to join the Traders Academy Club and improve your trading with us.
You will also find a pretty extensive database of educational materials here in the blog – just use the search or check out the Forex Education section above.
If you have any further questions, don’t hesitate to drop a comment below!
Happy Trading!
Arvinth Akash
Traders Academy Club Team.
Hi Traders! Ethereum short term forecast follow-up and update is here. On May 26th, 2026…
Hi Traders! GBPAUD short term forecast and technical analysis is here. We do our analysis…
Hi Traders! USDCHF short term forecast update and follow up is here. On May 20th,…
Hi Traders! CADCHF short term forecast and technical analysis is here. We do our analysis…
The dollar was broadly steady on Monday as cautious investors watched out for signals on…
Hi Traders! Arvinth here from the Home Trader Club team. The weekly summary and, review of July…