Hi Traders! Weekly summary and review October 29th, 2021 is here. It is now time to recap and summarize the trade setups that we had during this week. Below you will find the short explanation of all the trade setups we had this week and how it has currently developed now.
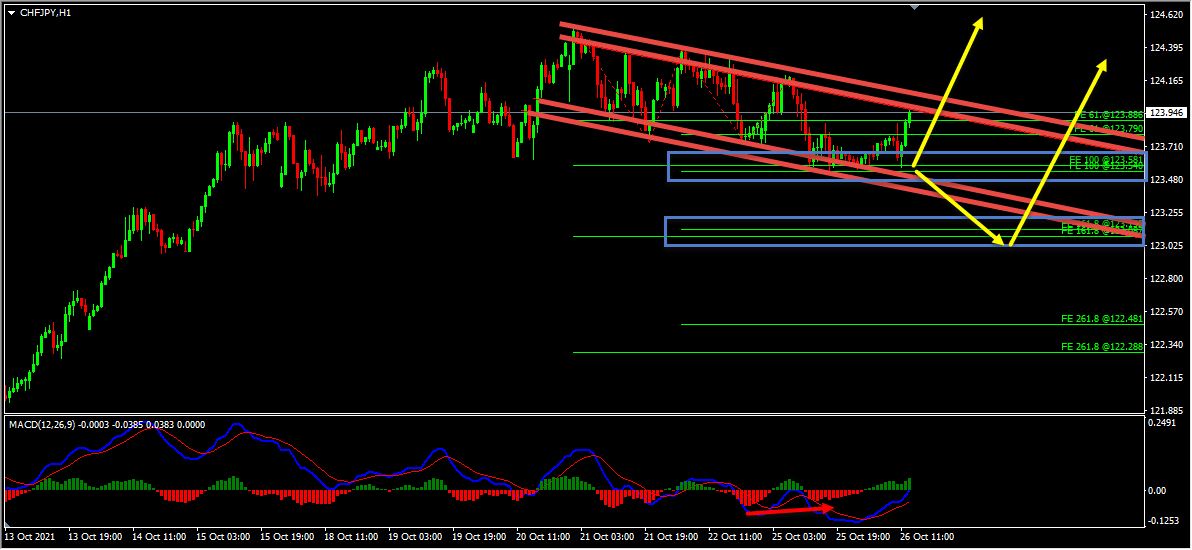
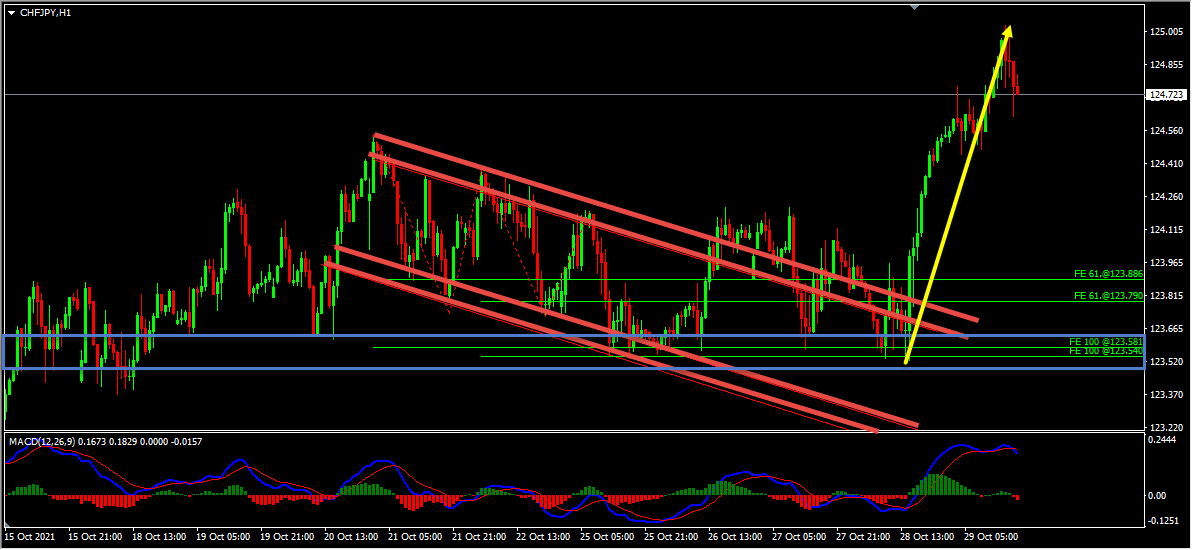
CHFJPY – My idea here was “Looking at the H1 chart, we could see that currently it looks like a flat correction is happening in the form of a range. While measuring the first and second wave inside this range we have two key support zones that has formed. The first key support zone is formed by the 100%(123.581) Fibonacci expansion level of the first wave, 100%(123.540) Fibonacci expansion level of the second wave and the bottom of the range. The second key support zone is formed by the 161.8%(123.135) Fibonacci expansion level of the first wave and 161.8%(123.087) Fibonacci expansion level of the second wave. Also, we have a bullish divergence that has formed between the first low that has formed at 123.722 and the second low that has formed at 123.534 based on the MACD indicator which we may consider as evidence of bullish pressure. Until both the key support zones hold my view remains bullish here. If the price breaks and holds above the top of this range we may then consider it as validation for the bullish view and may expect the price to move higher further”.
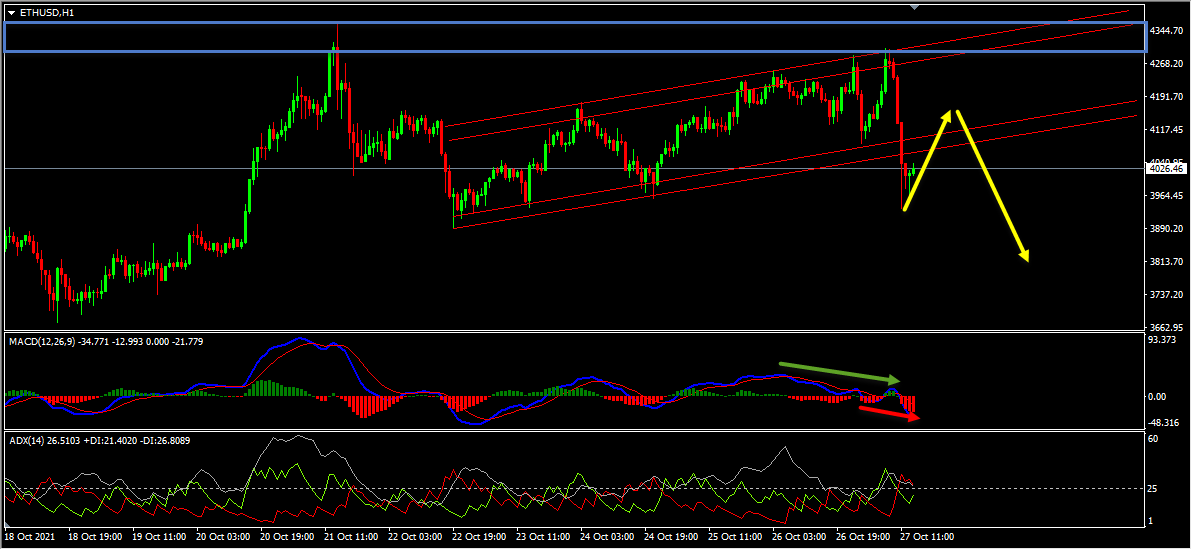
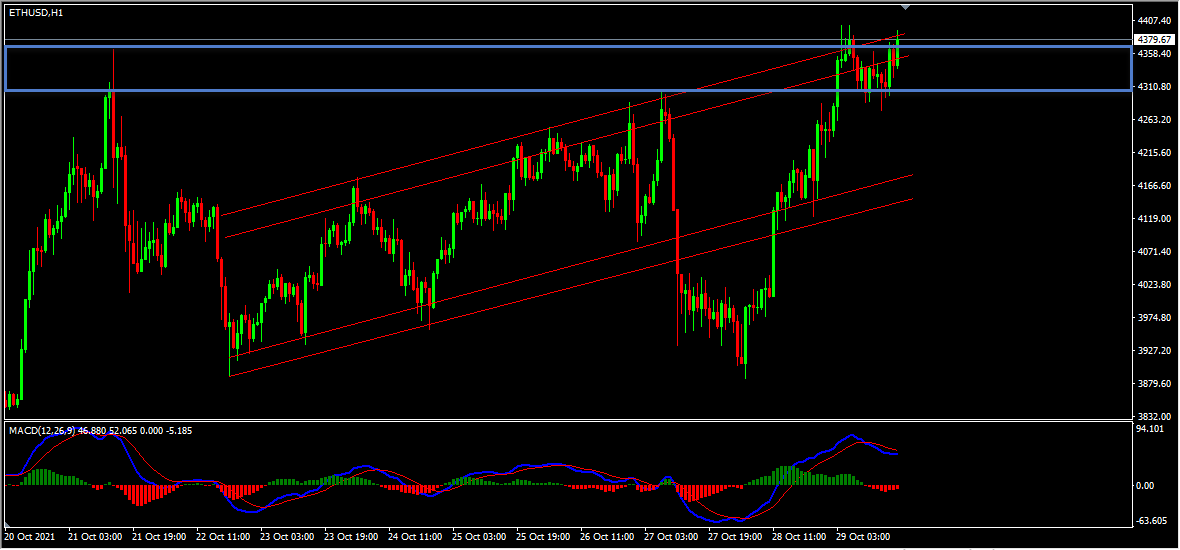
Ethereum – My idea here was “On the H1 chart, after the strong bearish move the price was moving inside a range. The price which was respecting this range so far has moved lower and has currently broken below the bottom of this range, which we may consider as evidence of bearish pressure. Also, we have a bearish divergence that has formed between the first high that has formed at 4252.01 and the second high that has formed at 4303.16 based on the MACD indicator which we may consider as evidence of bearish pressure. The price then moved lower and broke below the last low at 4085.10 thus creating lower lows which we may consider as another evidence of bearish pressure. In addition to this, the ADX indicator gave bearish signal at the cross of -DI (red line) versus +DI (green line) and the main signal line (silver line) reads value over 25 which we may consider as yet another evidence of bearish pressure. Currently it looks like a pullback is happening, until the strong resistance zone holds I expect short term bearish moves to happen here”.
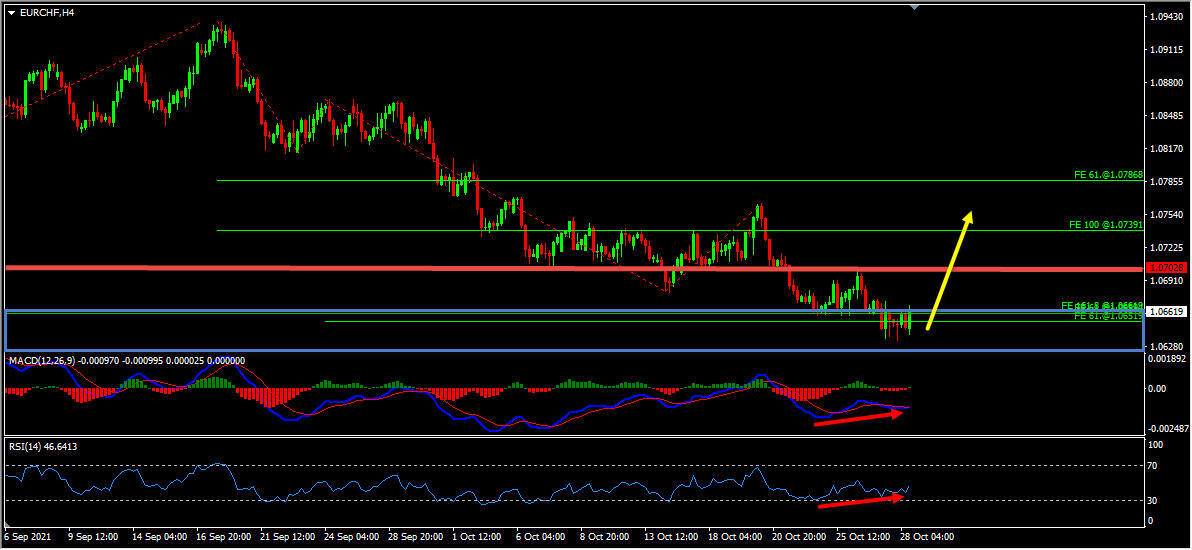
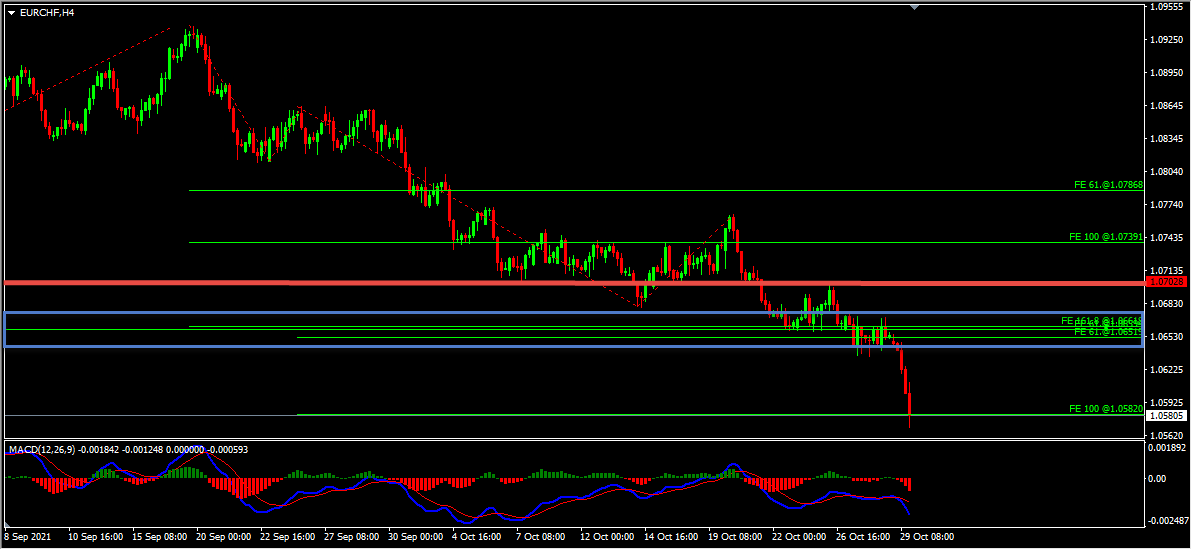
EURCHF – My idea here was “On the H4 chart, the price which is moving lower has currently reached a key support zone formed by the 161.8%(1.06618) Fibonacci expansion level of the first wave and the 61.8% (1.06519) Fibonacci expansion level of the second wave. In addition to this, the daily key support zone also coincides in the same area which makes this a very strong support zone. Also, we have a bullish divergence that has formed between the first low that has formed at 1.06581 and the second low that has formed at 1.06343 based on the MACD indicator. We have this bullish divergence on the RSI indicator as well, we may consider these as evidences of bullish pressure. So everything looks good here for the bulls and until the key support zone holds my short term view remains bullish here. If the price moves higher and breaks above the high at 1.07028 we may then consider it as a validation for the bullish view and may expect the price to move higher further in the short term”.
For similar trade ideas and much more I invite you to join the Traders Academy Club and improve your trading with us.
You will also find a pretty extensive database of educational materials here in the blog – just use the search or check out the Forex Education section above.
If you have any further questions, don’t hesitate to drop a comment below!
To your success,
Vladimir Ribakov
Certified Financial Technician
Hi Traders! Arvinth here from the Home Trader Club team. The weekly summary and, review of July…
European markets edged lower on Thursday following more overnight volatility in Asia’s tech-dominated indexes, while…
Hi Traders! EURGBP short term forecast and technical analysis is here. We do our analysis…
Hi Traders! Bitcoin short term forecast update and follow up is here. On May 7th,…
Hi Traders! AUDJPY short term forecast and technical analysis is here. We do our analysis…
Hi Traders! Oil short term forecast and technical analysis is here. We do our analysis…