Hi Traders! Weekly summary and review September 24th, 2021 is here. It is now time to recap and summarize the trade setups that we had during this week. Below you will find the short explanation of all the trade setups we had in this week and how it has currently developed now.
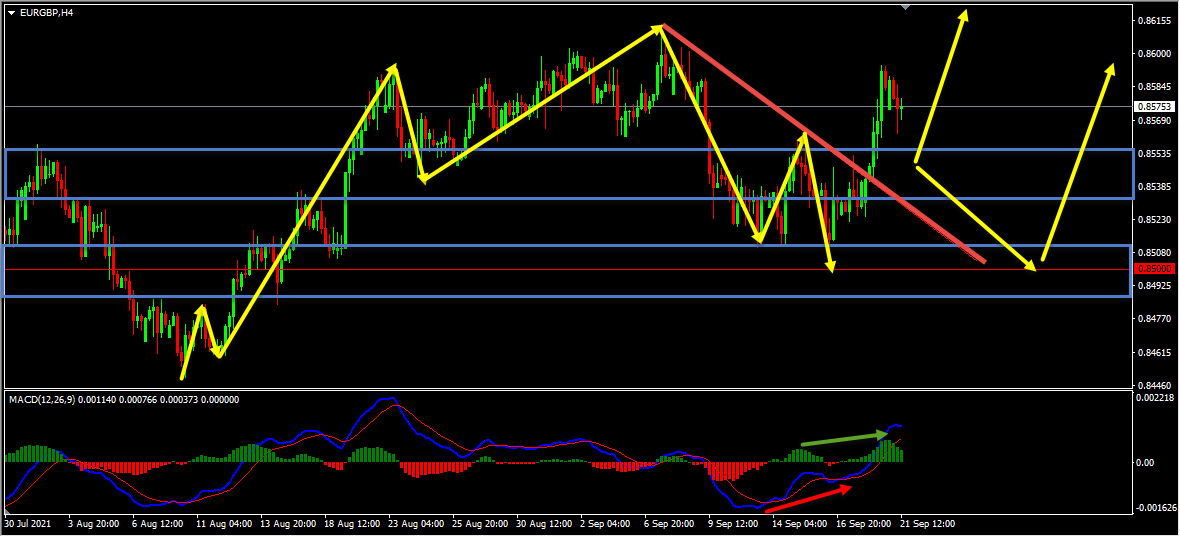
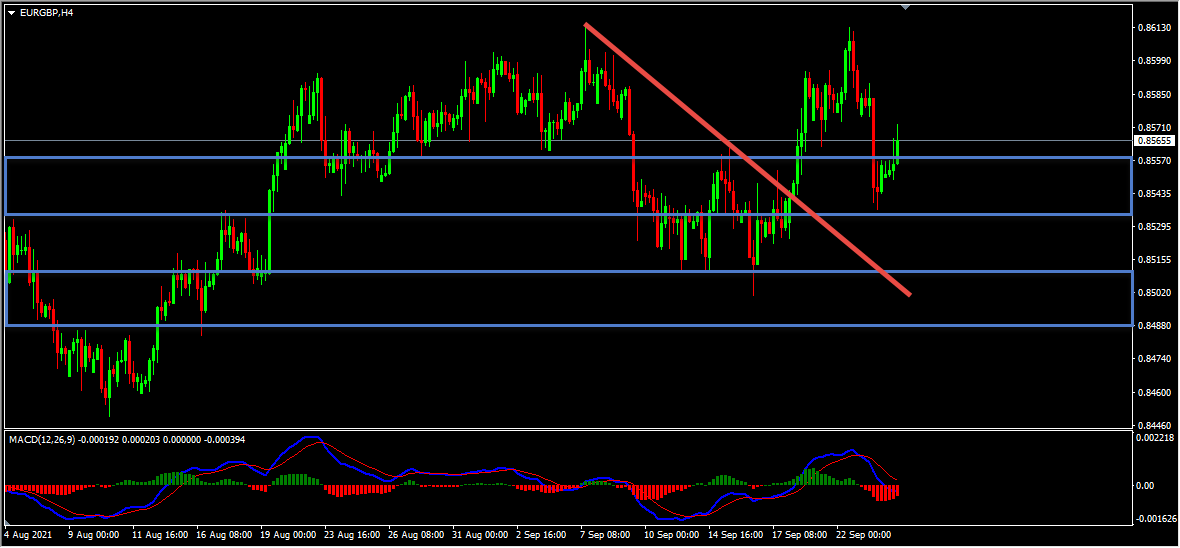
EURGBP – My idea here was “On the H4 chart, the price which is moving higher has created a bullish trend pattern in the form of three higher highs, higher lows, we may consider this as evidence of bullish pressure. Generally, after a bullish trend pattern, we may expect corrections and then potential continuation higher. Currently it looks like the correction has happened in the form of double wave down. Also, we have a bullish divergence that has formed between the first low that has formed at 0.85102 and the second low that has formed at 0.85006 based on the MACD indicator. Then the price moved higher and broke above the last high at 0.85624 creating higher highs, thus forming a classical setup of bullish divergence followed by bullish convergence. Hence as per the book scenario, after a bullish convergence, we may look for corrections to happen and then further continuation to the upside. In addition to this, we also had a breakout of the most recent downtrend line which we may consider as yet another evidence of bullish pressure. Currently it looks like a correction is happening, until both the strong support zones shown in the image below holds my view remains bullish here and I expect the price to move higher further”.
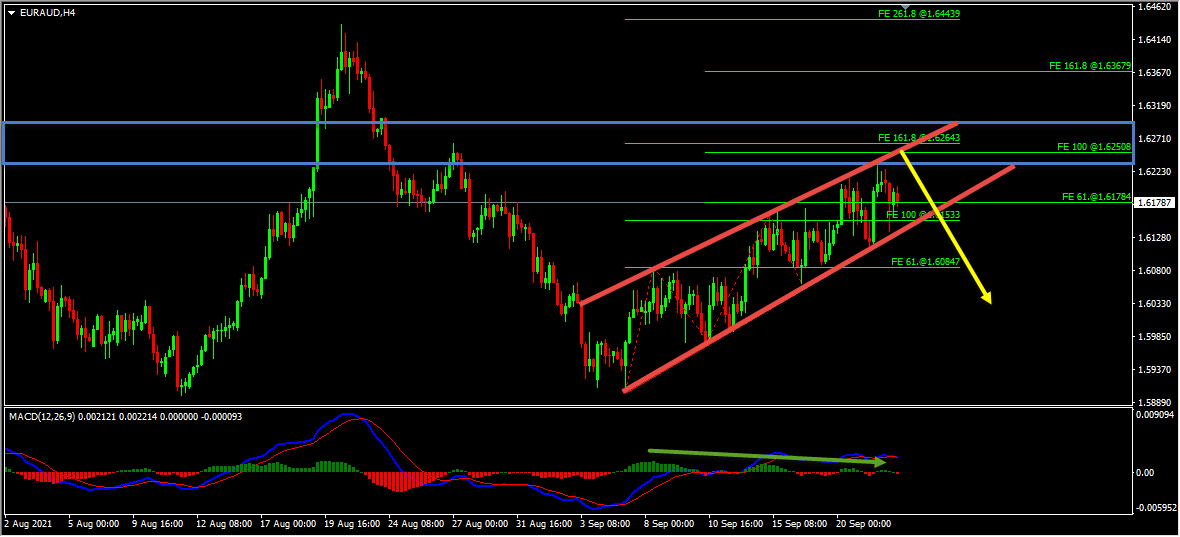
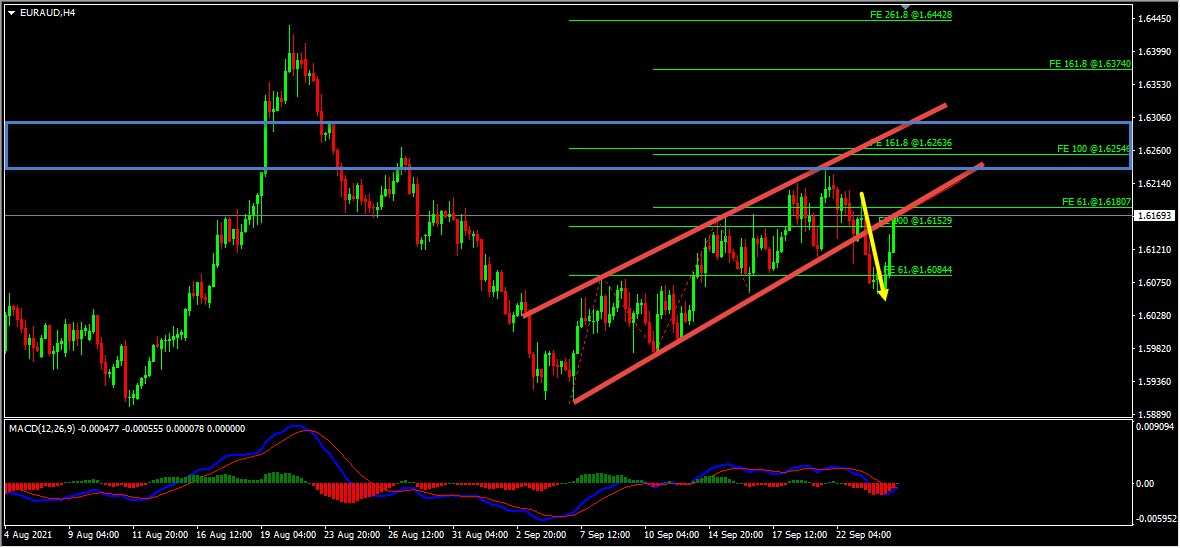
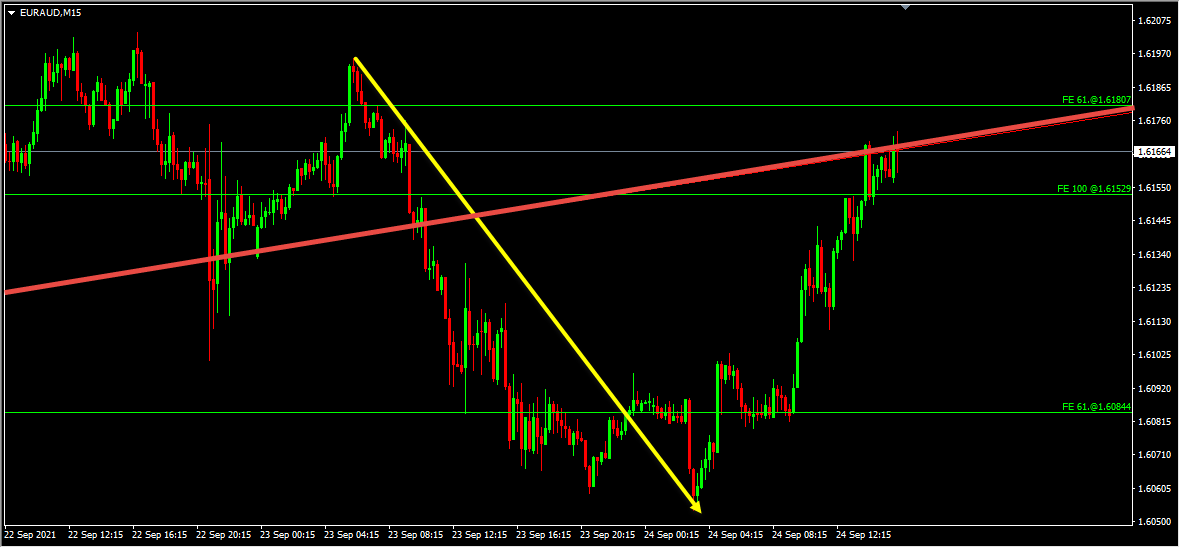
EURAUD – My idea here was “On the H4 chart, after the strong bearish move currently it looks like a correction is happening in the form of a range. This range is formed by the highs and lows reaching parallel resistance and support zones. In addition to this, while measuring the first and second wave inside this range using the Fibonacci expansion tool, we have a key resistance zone that has formed. This key resistance zone is formed by the 161.8%(1.62643) Fibonacci expansion level of the first wave, the 100%(1.62508) Fibonacci expansion level of the second wave and the top of this range. Also, we have a bearish divergence that has formed between the first high that has formed at 1.60848 and the second high that has formed at 1.62334 based on the MACD indicator. Until the key resistance zone holds my view remains bearish here. If the price breaks and holds below the bottom of this range we may then consider it as a validation for the short term bearish view and may expect the price to continue lower further”.
You can find a detailed explanation regarding this here: EURAUD Short Term Forecast Update And Follow Up
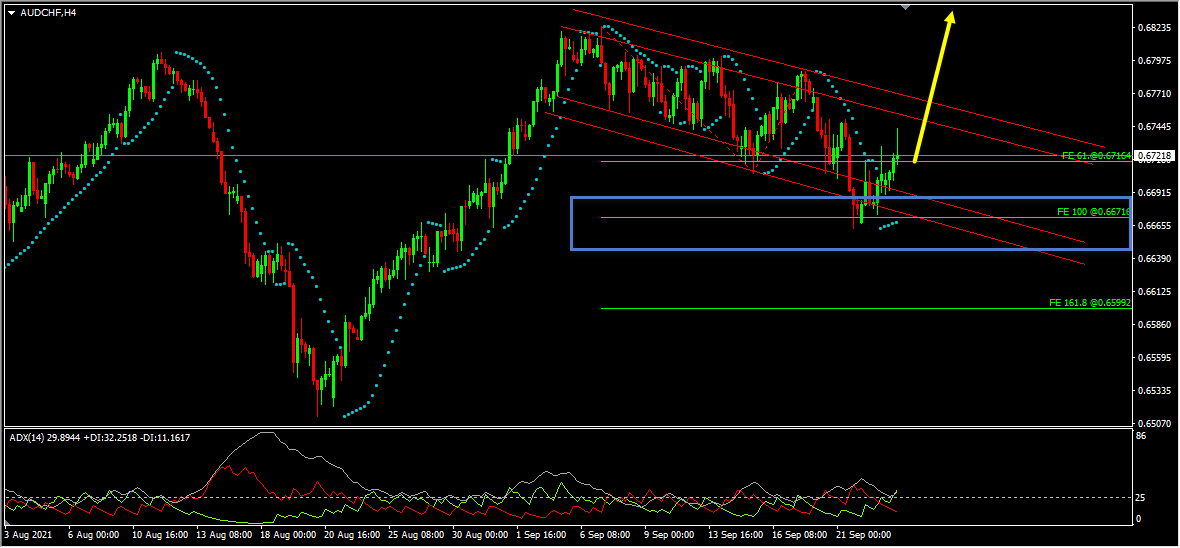
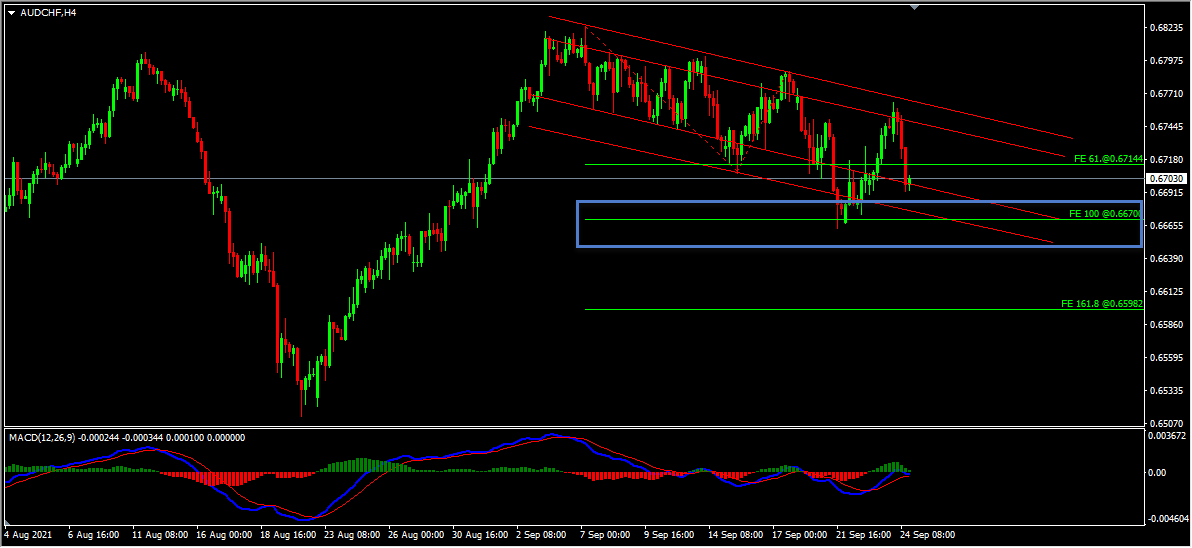
AUDCHF – My idea here was “Looking at the H4 chart, we could see that currently it looks like a flat correction is happening in the form of a range. While measuring the first wave inside this range we have a key support zone that has formed.based on the 100%(0.66716) Fibonacci expansion level of the first wave and the bottom of the range. The price has currently reached this key support zone, respected it and is bouncing higher from this zone. In addition to this, the ADX indicator gave a bullish signal here at the cross of +DI (green line) versus -DI (red line) and the main signal line (silver line) reads value over 25, we may consider this as evidence of bullish pressure. Until this key support zone holds my view remains bullish here. If the price breaks and holds above the top of this range we may then consider it as a validation for this bullish view and may expect the price to continue higher further”.
For similar trade ideas and much more I invite you to join the Traders Academy Club and improve your trading with us.
You will also find a pretty extensive database of educational materials here in the blog – just use the search or check out the Forex Education section above.
If you have any further questions, don’t hesitate to drop a comment below!
To your success,
Vladimir Ribakov
Certified Financial Technician
Hi Traders! Arvinth here from the Home Trader Club team. The weekly summary and, review of July…
The Japanese yen surged on Thursday, in a move analysts said bore the hallmarks of…
Hi Traders! EURAUD short term forecast and technical analysis is here. We do our analysis…
Hi Traders! NZDCAD short term forecast update and follow up is here. On June 2nd,…
Hi Traders! NZDCHF short term forecast and technical analysis is here. We do our analysis…
Hi Traders! AUDUSD short term forecast follow-up and update is here. On May 27th 2026…