Understanding market volatility is an important part of successful trading.
Financial markets do not move at the same speed all the time. Some periods are characterized by relatively small price movements, while others experience sharp fluctuations, sudden breakouts and increased market activity.
For traders, recognizing these changes can provide valuable information about current market conditions.
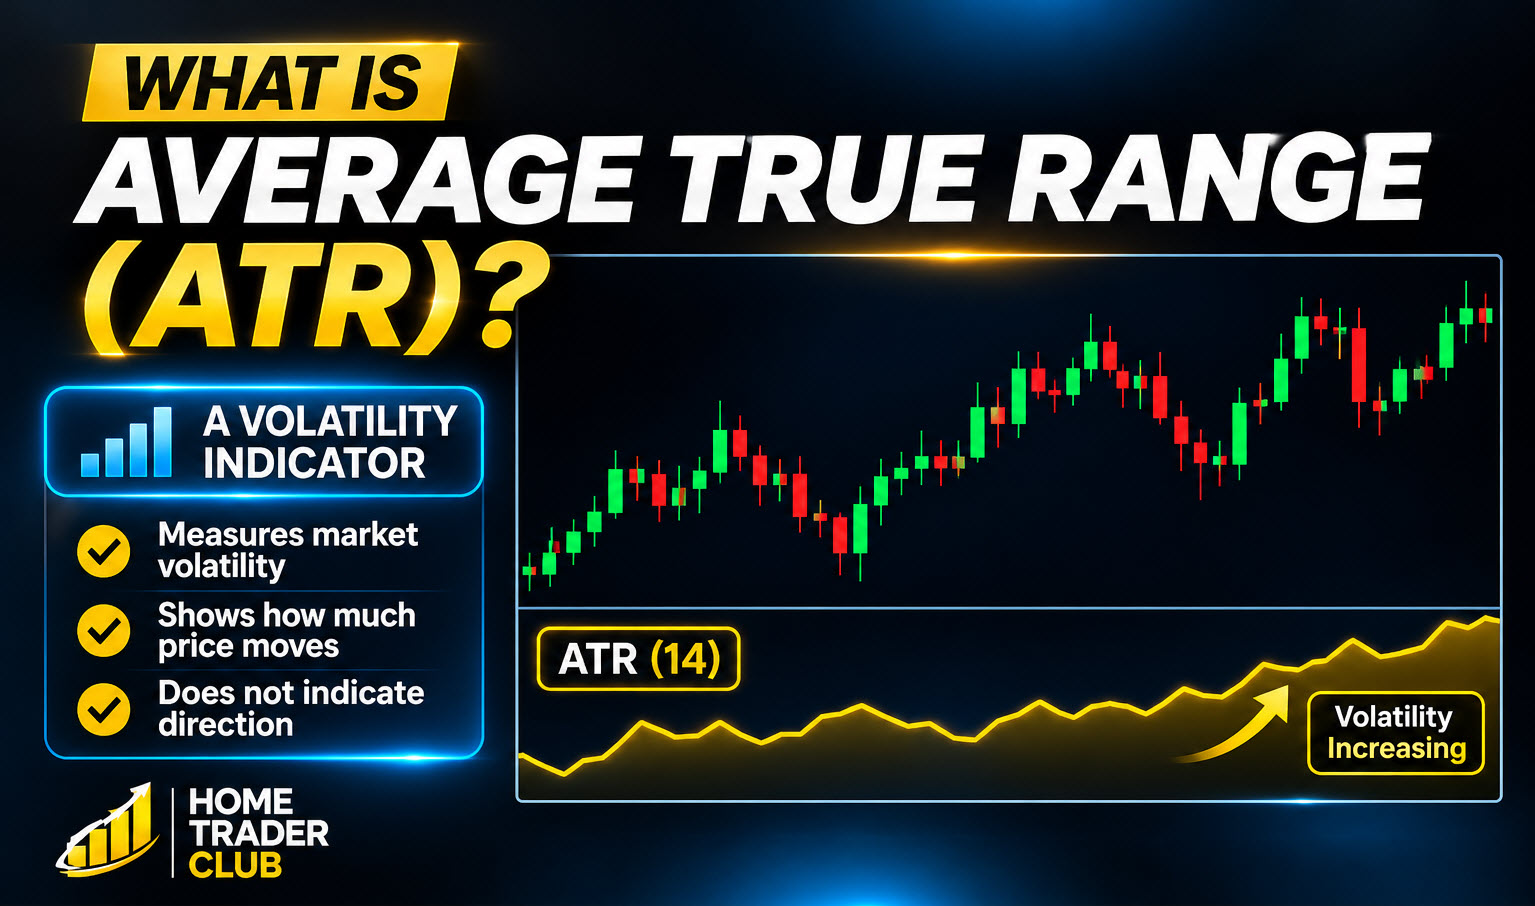
One technical indicator specifically designed to measure market volatility is the Average True Range (ATR).
Developed by J. Welles Wilder, ATR helps traders understand how much an instrument typically moves over a selected period. It can be used to assess changing volatility, identify periods of market expansion or contraction, evaluate trading conditions and improve risk-management decisions.
However, there is an important distinction: ATR measures the magnitude of price movement, not its direction.
A rising ATR does not automatically mean that the market is bullish, and a falling ATR does not necessarily indicate that prices will decline.
In this complete guide, we will explore how the Average True Range works, how it is calculated, how traders interpret its readings and how it can be incorporated into a broader technical analysis strategy.
We have partnered with AvaTrade, one of the industry’s leading regulated brokers.
When you open and trade with AvaTrade through our partnership, you receive:
If you’re looking to accelerate your trading journey while enjoying premium education, this partnership gives you everything you need under one roof.
If you already have account with them, still follow this link to open separate account with separate email. Once you did that, contact me with the telegram link below and we will give you the access.
The Average True Range is a technical indicator that measures market volatility by calculating the average True Range of price movements over a selected number of periods.
It was introduced by J. Welles Wilder in his 1978 book, New Concepts in Technical Trading Systems.
The indicator was originally developed to measure volatility in markets where price gaps and large movements could make ordinary high-to-low measurements less representative of actual price activity.
ATR addresses this limitation by considering the previous closing price when calculating the range of each period.
The result is a smoothed measurement of how much the market has been moving.
Traders commonly use ATR to:
The ATR indicator is commonly displayed as a separate line below the main price chart.
Its value changes as new price data becomes available.
The most widely used setting is 14 periods, although traders can experiment with different settings depending on their strategy and timeframe.
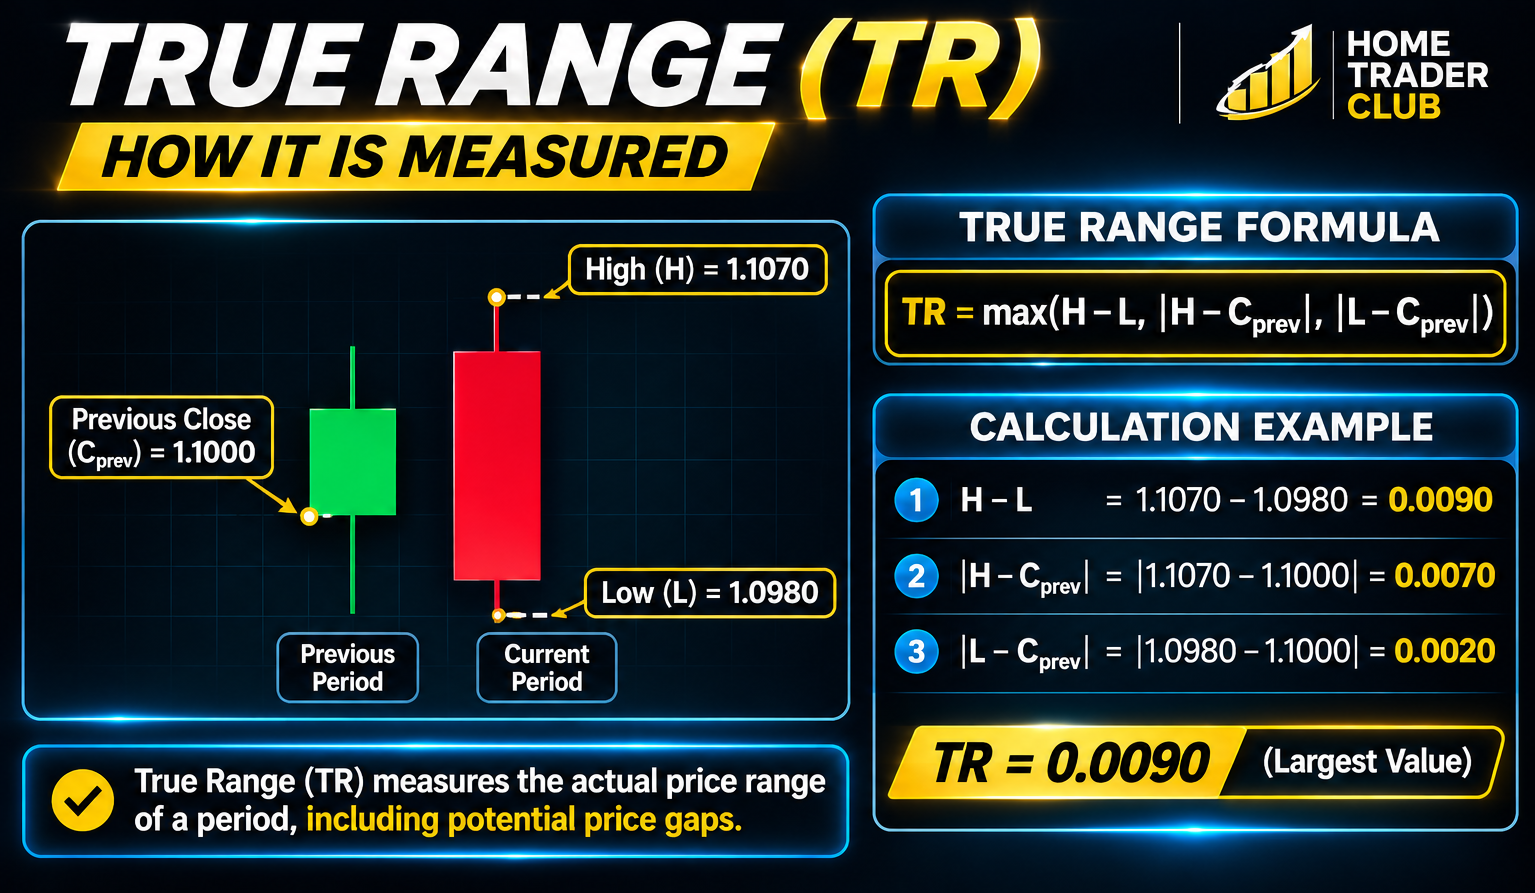
To understand ATR, we first need to understand the concept of True Range.
True Range measures the actual price range of a particular period while accounting for potential gaps between consecutive closing prices.
It considers three possible measurements:
The largest of these three values becomes the True Range.
True Range Formula:
[
TR = \max(H-L,\ |H-C_{previous}|,\ |L-C_{previous}|)
]
Where:
Imagine that the previous trading period closes at 100, while the next period opens significantly higher.
If we calculate volatility using only the current high and low, we may overlook part of the price movement that occurred between the previous close and the current trading range.
True Range accounts for this difference.
This makes it more comprehensive than simply measuring the distance between the high and low of each candle.
The purpose is to capture a more realistic representation of price movement during the selected period.
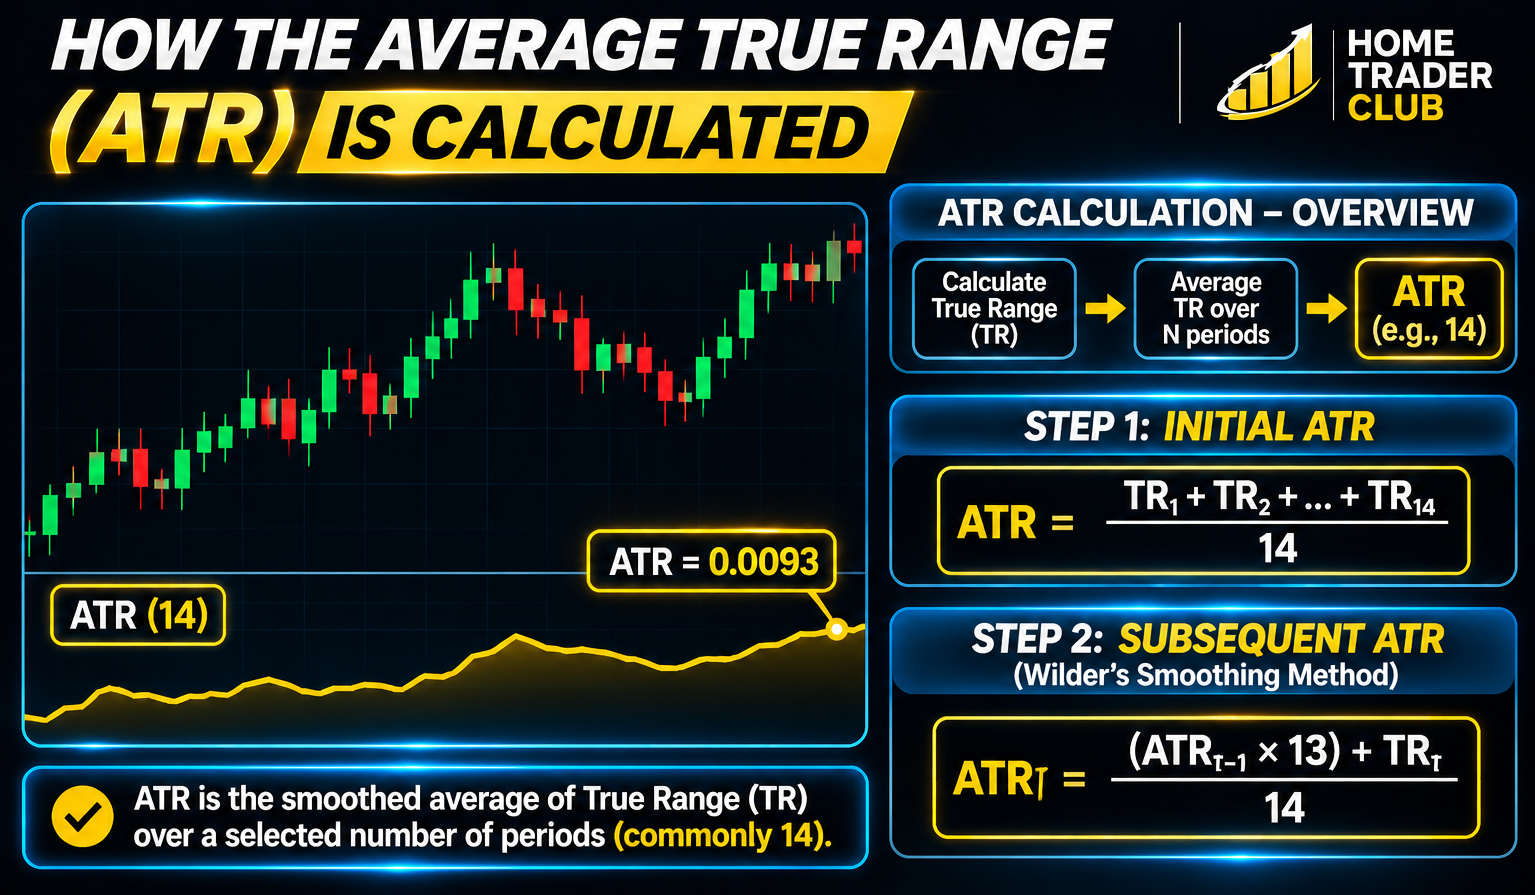
Once True Range has been calculated for each period, ATR smooths those readings to produce an average volatility measurement.
The commonly used ATR setting is 14 periods.
The calculation generally follows two stages.
The first ATR reading is calculated by taking the arithmetic average of the initial True Range values.
For a 14-period ATR:
[
ATR = \frac{TR_1+TR_2+\cdots+TR_{14}}{14}
]
This establishes the initial ATR value.
Wilder’s smoothing method is then used to calculate subsequent readings.
The formula is:
[
ATR_t = \frac{(ATR_{previous}\times 13)+TR_t}{14}
]
More generally:
[
ATR_t = \frac{(ATR_{previous}\times(n-1))+TR_t}{n}
]
Where:
This smoothing method allows ATR to respond to changing volatility without reacting as sharply as an unsmoothed range measurement.
A sudden increase in True Range will influence the ATR value, but the effect is distributed through the smoothing process.
This is why ATR generally moves more gradually than individual candle ranges.
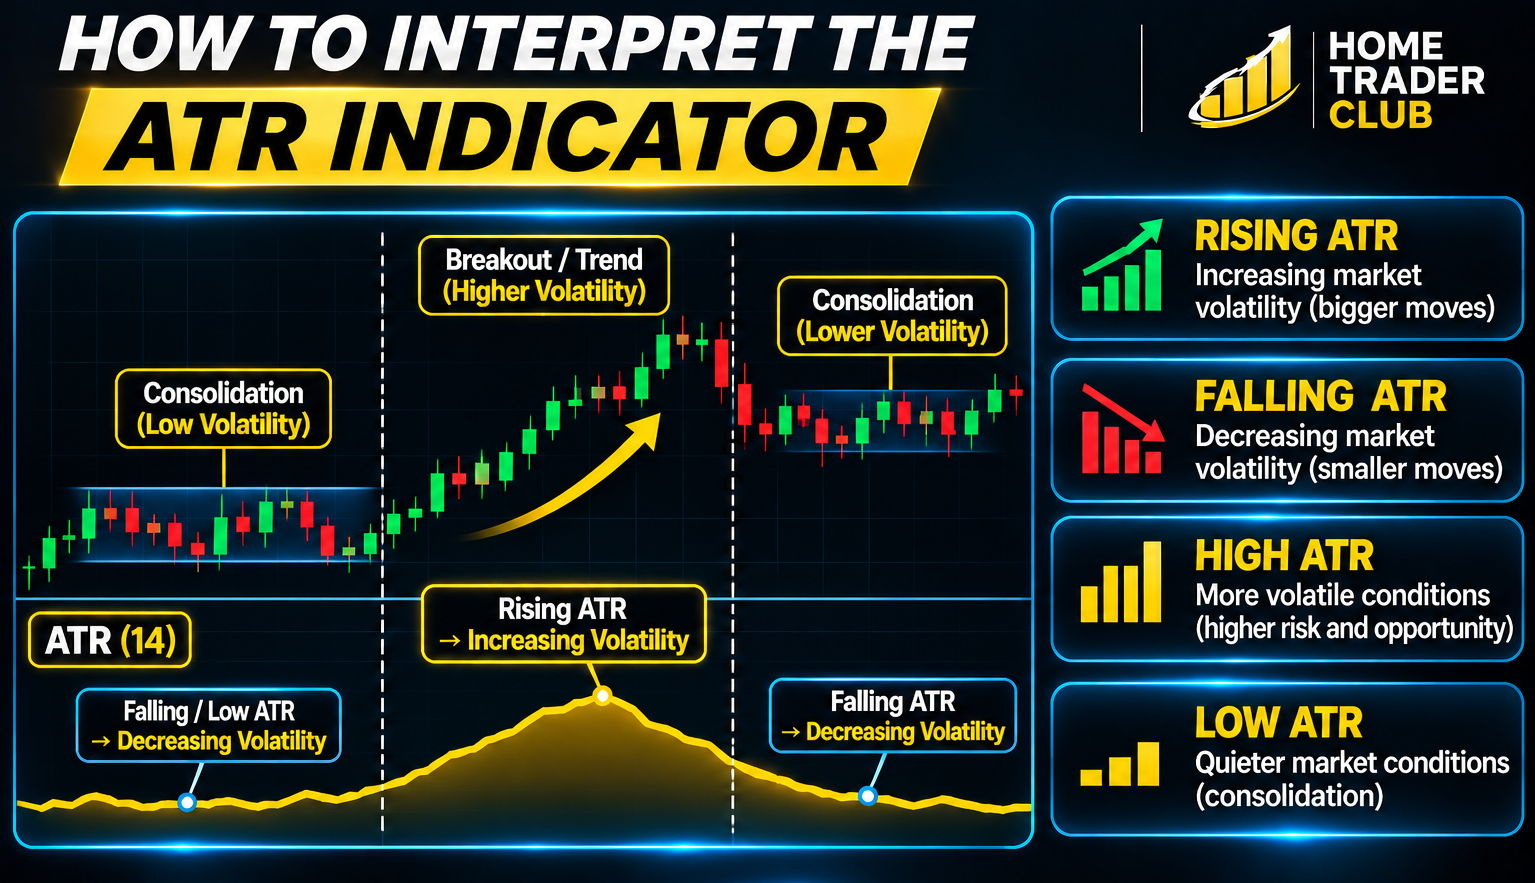
Interpreting ATR is relatively straightforward once traders understand what it measures.
The most important factor is the direction and behavior of the ATR line rather than treating a particular numerical value as universally high or low.
When ATR rises, it indicates that the average True Range is increasing.
In practical terms, price movements are becoming larger compared with the recent historical average.
This may happen during:
A rising ATR tells traders that market activity is expanding.
However, it does not identify whether buyers or sellers are in control.
Both strong upward movements and sharp downward movements can produce increasing ATR readings.
When ATR declines, it indicates that average price ranges are becoming smaller.
This often occurs during periods of consolidation or reduced market activity.
A falling ATR may be associated with:
A declining ATR does not necessarily mean that a market is preparing to reverse.
It simply indicates that the magnitude of recent price movement is decreasing.
A relatively high ATR indicates that the market is experiencing larger price fluctuations.
These conditions may create more opportunities for traders, but they can also increase risk.
Stops may need more room, position sizes may need adjustment, and unexpected price movements can become more significant.
Importantly, an ATR value should be evaluated against the historical behaviour of the same instrument and timeframe.
A relatively low ATR indicates that recent price ranges are smaller.
This may suggest that the market is consolidating or experiencing reduced volatility.
However, low volatility should not automatically be interpreted as low risk.
A quiet market can transition into a highly volatile environment, sometimes very quickly.
One of the most common questions traders ask is why ATR is generally set to 14.
The number 14 represents the number of chart periods used in the calculation.
It does not represent 14 pips, 14 points or a fixed volatility level.
For example:
The ATR value therefore depends on both the selected period and the chart timeframe.
A 14-period ATR provides a balance between responsiveness and smoothing.
Shorter periods generally react more quickly to recent changes in price activity, while longer periods produce smoother readings that reflect a broader volatility environment.
There is no universally perfect setting.
Traders should select a period that matches their analytical approach and evaluate it through historical testing.
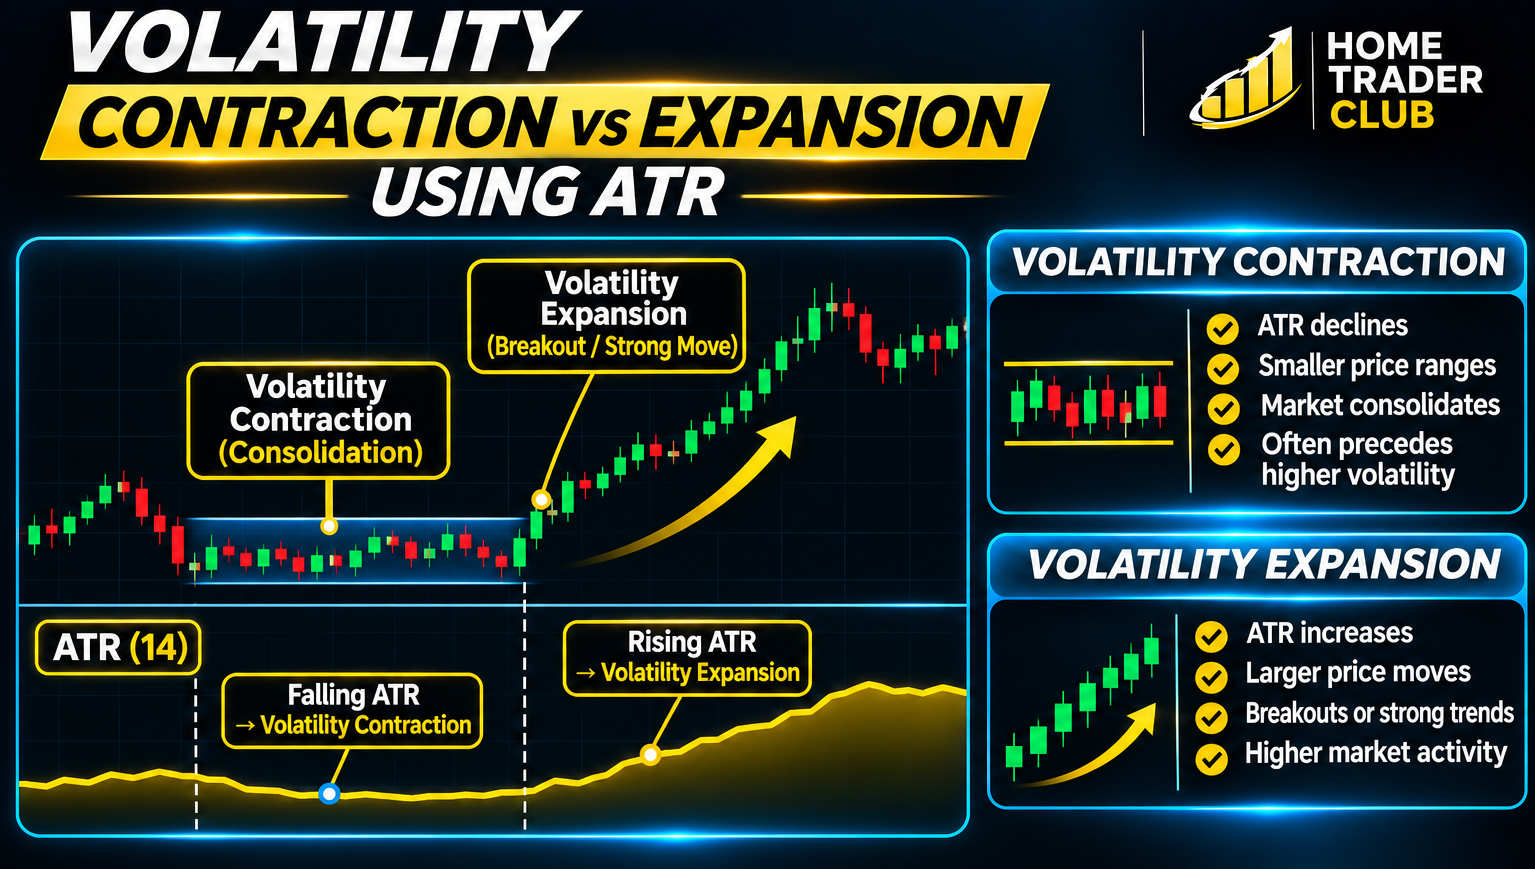
One of the most useful applications of ATR is identifying whether volatility is expanding or contracting.
Understanding these changes can help traders evaluate the environment in which they are making decisions.
When ATR gradually declines, it suggests that the average size of price movements is becoming smaller.
This may occur when the market enters a consolidation phase.
During such periods, price may move within a relatively narrow range while market participants wait for new information or a shift in supply and demand.
A volatility contraction can sometimes precede a period of expansion, but ATR alone cannot predict when that expansion will occur or which direction price will take.
When ATR begins increasing after a period of relatively low readings, it indicates that price ranges are expanding.
This may accompany a breakout, a strong directional movement or a sudden increase in market activity.
Traders can use this information to recognize that market conditions are changing.
However, increasing volatility does not automatically confirm a valid breakout.
Price structure, market direction and other technical evidence should also be considered.
Instead of looking at an ATR value in isolation, traders can compare the current reading with its recent history.
For example, they can evaluate whether the current ATR is:
This provides a better understanding of whether the current market environment is relatively quiet or unusually active.
ATR is a flexible indicator that can support several aspects of technical analysis.
It is generally most useful when combined with price action and other analytical tools.
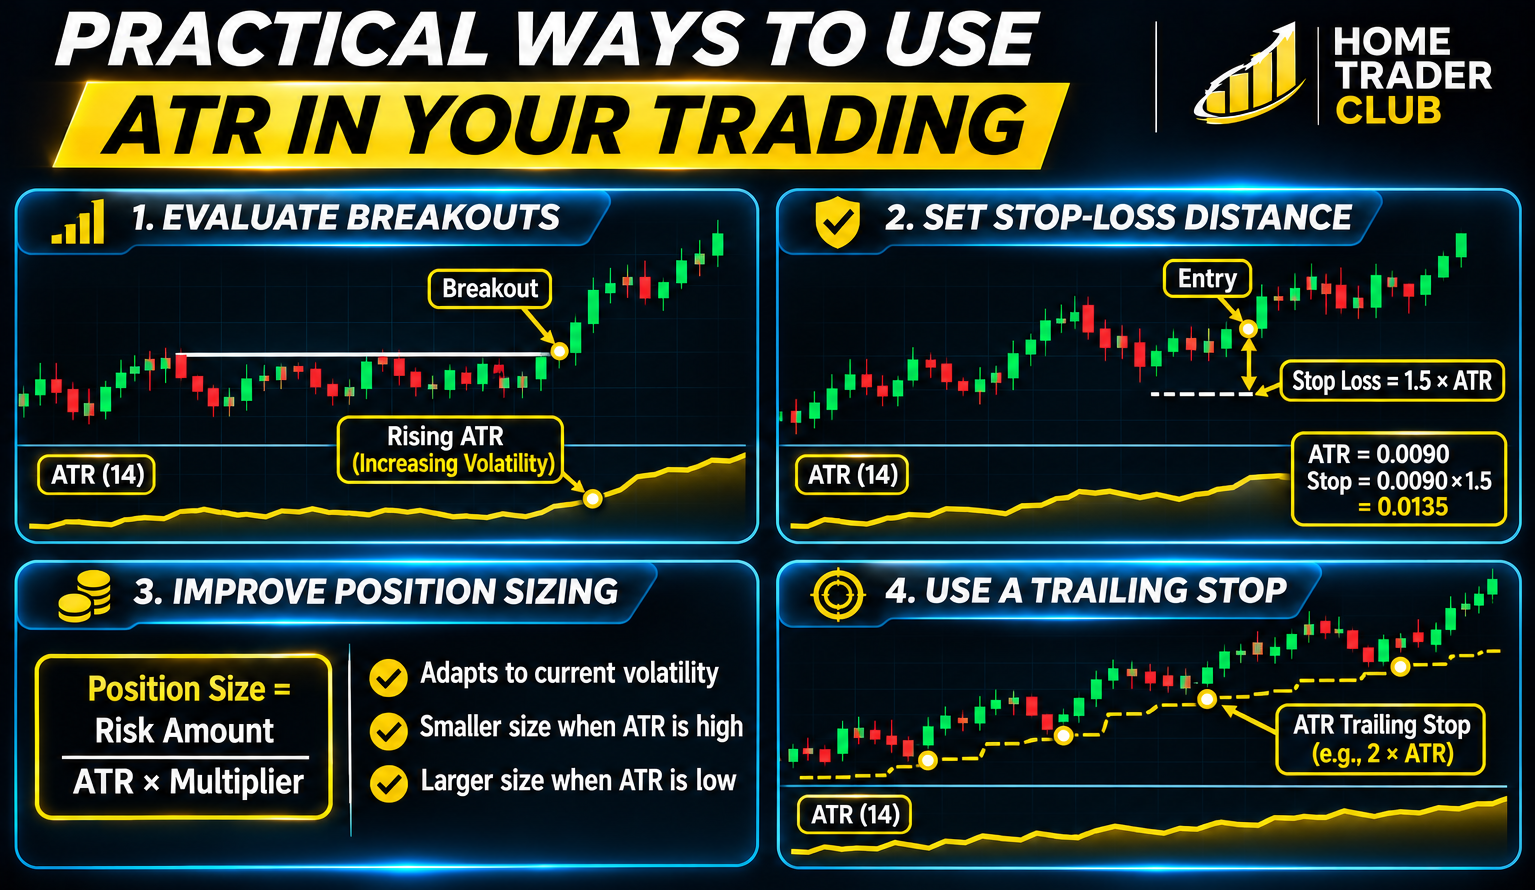
Breakouts often occur when price moves beyond an established support or resistance area.
ATR can help traders evaluate whether market volatility is expanding around the breakout.
For example, a breakout accompanied by increasing ATR indicates that the average size of price movements is expanding.
This can provide additional information about market participation and activity.
However, increasing ATR does not confirm that the breakout will continue.
Traders should also examine candle structure, closing prices, market direction and the surrounding technical levels.
When price moves within a narrow range and ATR declines, it may indicate a period of volatility contraction.
This information can help traders recognize that market conditions are becoming quieter.
Rather than forcing trades during an environment with limited price movement, traders can monitor the market for signs of a meaningful change in volatility.
ATR is frequently used to adapt stop-loss distances to changing volatility.
Instead of relying entirely on fixed pip distances, traders can calculate stop distances using ATR multiples.
This allows stop placement to reflect the recent size of price movements.
However, ATR should not replace technical market structure.
Support, resistance and trade invalidation levels remain important considerations.
For a detailed explanation, see our dedicated article:
ATR Stop Loss Strategy in Forex: How to Set Stops Based on Market Volatility.
Volatility can influence how much capital a trader should expose to a particular position.
When ATR increases, the distance required for a volatility-based stop may also increase.
If the trader wants to maintain the same monetary risk, position size may need to decrease.
This helps create a more consistent relationship between market volatility and account risk.
ATR can also be used in trailing-stop methods.
A trailing stop adjusts as the market moves in the favourable direction, helping traders manage an open position while allowing room for normal price fluctuations.
Using ATR multiples can make the trailing distance responsive to changing volatility.
The specific method and multiplier should be tested according to the trading strategy.
ATR is not the only indicator used to measure market volatility.
Traders also use tools such as Bollinger Bands and standard deviation.
Although these indicators examine aspects of market variability, they work differently.
ATR measures the average True Range over a selected period.
It focuses on the magnitude of price movement and accounts for gaps between consecutive periods.
It does not indicate market direction.
Bollinger Bands use a moving average and standard deviation to create upper and lower bands around price.
The distance between the bands changes as volatility changes.
When the bands contract, volatility is generally lower. When they expand, volatility is generally increasing.
Unlike ATR, Bollinger Bands are displayed around the price chart.
Standard deviation measures how widely values are distributed around their average.
In technical analysis, it is often used to evaluate price variability and forms part of several volatility-based indicators.
ATR and standard deviation therefore provide different perspectives on market conditions.
Traders can use them together, but they should understand what each indicator measures rather than assuming they provide identical information.
An important limitation of ATR is that its standard reading is expressed in the price units of the instrument being analyzed.
This means that the absolute ATR value of one instrument cannot automatically be compared with the ATR value of another instrument.
Different instruments have different price scales, contract specifications and typical ranges.
A higher numerical ATR does not necessarily mean that one instrument is proportionally more volatile than another.
One way to make comparisons more meaningful is to calculate ATR as a percentage of the current price.
The formula is:
[
ATR% = \frac{ATR}{Current\ Price}\times100
]
This expresses ATR relative to the instrument’s price level.
It can help traders compare volatility across instruments with different price scales.
However, comparisons should still consider the timeframe, data quality and characteristics of the instruments involved.
Although ATR is relatively easy to understand, there are several mistakes that can lead to incorrect interpretations.
ATR measures volatility, not whether price will rise or fall.
A rising ATR can occur during strong bullish or bearish movements.
Traders should use directional analysis separately.
ATR does not have universal overbought or oversold levels.
A high reading indicates increased price movement, not necessarily that the market is ready to reverse.
Low volatility does not guarantee stable market conditions.
Periods of low volatility can be followed by sudden price expansion.
Risk management remains important regardless of the current ATR reading.
ATR values are expressed in the price units of the instrument.
Comparing them directly across instruments with different price scales can produce misleading conclusions.
Relative measurements such as ATR percentage can provide additional context.
ATR (14) does not measure the same period of time on every chart.
The indicator must be interpreted according to the timeframe on which it is calculated.
Constantly changing ATR periods in response to recent market movements can create inconsistent analysis.
Traders should establish a suitable setting, test it and evaluate its effectiveness over a meaningful sample of market conditions.
ATR is a volatility measurement, not a complete trading system.
It does not independently provide reliable entry signals, market direction or confirmation of trend reversals.
Combining ATR with price action, market structure and other analytical methods can provide a more complete view.
Traders can incorporate ATR into their regular chart analysis through a simple and consistent process.
Step 1: Select the appropriate timeframe.
Choose the timeframe that matches the trading strategy.
Step 2: Apply the ATR indicator.
Start with the commonly used 14-period setting and understand how your trading platform calculates and displays the indicator.
Step 3: Assess the current reading.
Determine whether volatility is relatively high, low, rising or declining compared with its recent history.
Step 4: Examine price action.
Look at the relationship between ATR and the actual price chart.
Determine whether volatility expansion is accompanying a breakout, a strong trend movement or a sudden reversal.
Step 5: Adjust risk decisions.
Consider how current volatility affects stop placement, position sizing and the amount of price fluctuation your strategy can reasonably accommodate.
Step 6: Monitor changes.
Continue observing ATR as new candles form.
Volatility conditions can change, so decisions should not rely exclusively on an old ATR reading.
Step 7: Test your approach.
Evaluate how ATR-based analysis performs under different market conditions.
Backtesting and forward testing can help determine whether the indicator adds meaningful value to your trading process.
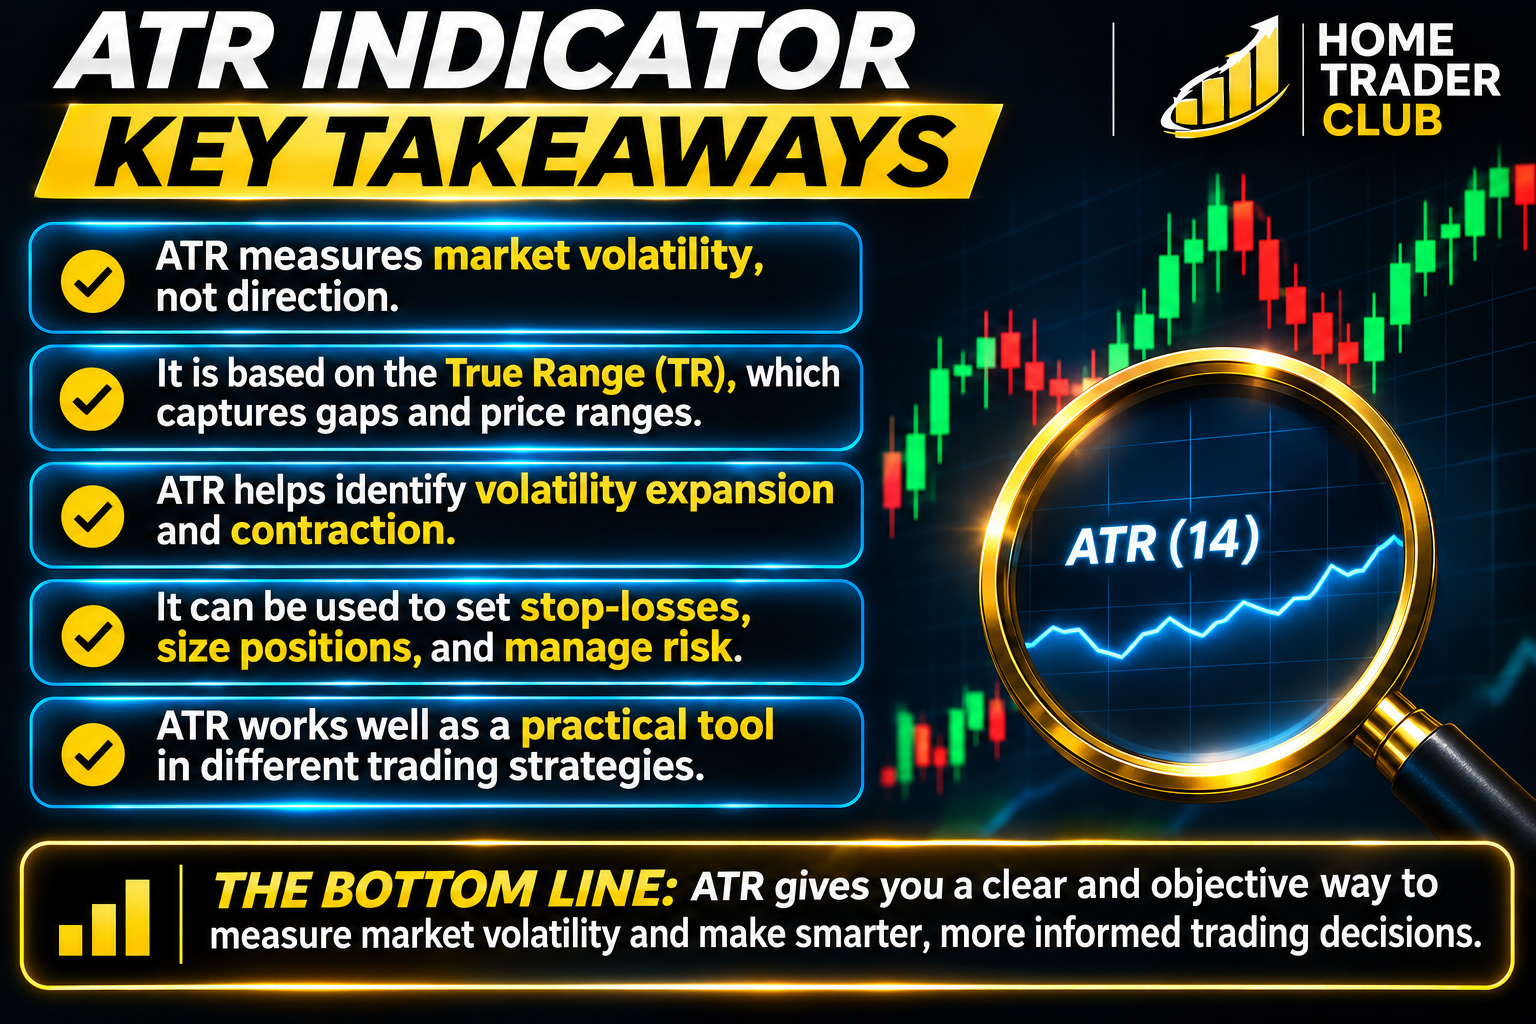
The Average True Range is one of the most useful technical indicators for understanding market volatility.
By measuring the average True Range over a selected period, it helps traders identify whether price movements are expanding or contracting.
It can provide valuable information about market conditions, breakout activity, consolidation, stop placement and risk management.
However, ATR should never be confused with a directional indicator.
A rising ATR does not automatically mean the market is bullish, and a falling ATR does not guarantee a bearish reversal.
Its real value comes from helping traders understand how much the market is moving and whether current volatility is suitable for their trading approach.
When combined with price action, technical market structure and disciplined risk management, ATR can become a valuable part of a well-developed trading framework.
Successful trading is not simply about identifying market direction. It is also about understanding market conditions, adapting to changing volatility and managing risk consistently.
To Your Trading Success,
Vladimir Ribakov
Internationally Certified Financial Technician (CFTe)
Home Trader Club
Forex and CFD trading involve significant risk and may not be suitable for every investor. Leverage can amplify both profits and losses, and traders may lose some or all of their invested capital. Technical indicators such as ATR are based on historical price data and cannot predict future market movements or guarantee trading results. The information in this article is provided for educational purposes only and should not be considered financial or investment advice. Always assess your financial circumstances and risk tolerance before trading.
This week, I am watching four markets for potential trading opportunities: EUR/USD, USD/JPY, Gold and…
The Forex market is one of the largest and most liquid financial markets in the…
One of the most important decisions in Forex trading is determining where to place a…
The financial markets are entering another potentially volatile week, with several interesting technical developments creating…
Why Consumer Confidence Matters in Forex Trading When analyzing the Forex market, traders often pay…
When traders study the Forex market, they often focus on economic indicators such as inflation,…