One of the most important decisions in Forex trading is determining where to place a stop loss.
Many traders use fixed pip distances when setting their stop-loss levels. Although this approach is simple, it does not always account for changing market conditions.
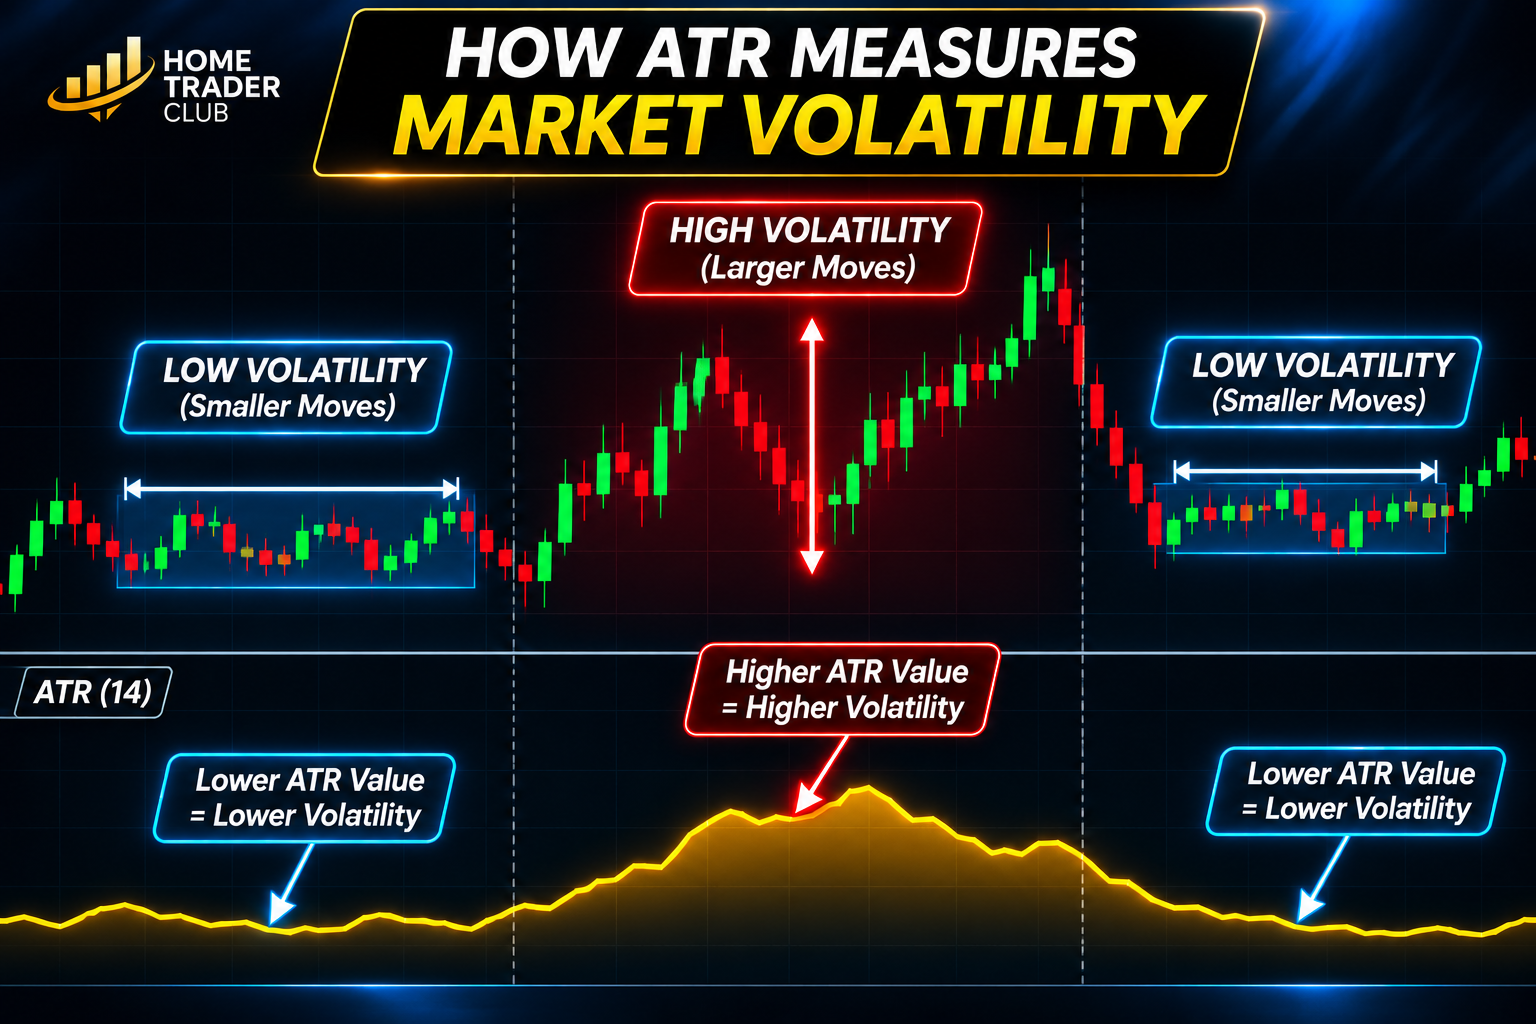
The Forex market does not maintain the same level of volatility throughout every trading session or market environment. Sometimes price movements are relatively small and controlled. At other times, volatility increases, producing larger price fluctuations.
Using the same stop-loss distance in both situations can create problems.
A stop that works reasonably well during a quiet market may be too tight when volatility increases. Similarly, a very wide stop may expose a trader to unnecessary risk when market conditions are relatively calm.
This is where the Average True Range (ATR) indicator becomes useful.
An ATR stop-loss strategy allows traders to adjust their stop distances according to market volatility rather than relying entirely on fixed pip values.
In this guide, we will explore how ATR-based stop losses work, how to calculate appropriate stop distances, how to choose ATR multipliers, and how to incorporate volatility into a structured risk-management approach.
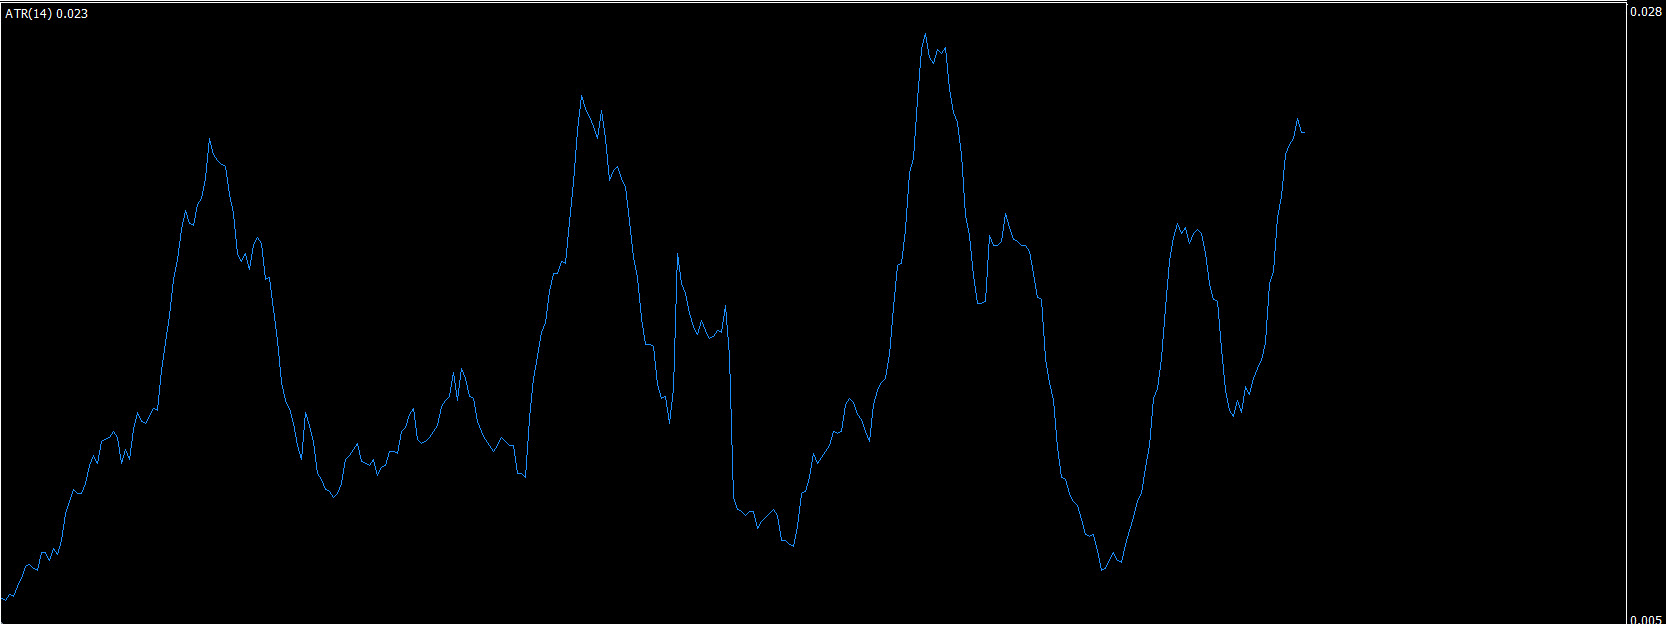
The Average True Range (ATR) is a technical indicator that measures market volatility.
It was developed by J. Welles Wilder and is commonly used by traders to understand how much an instrument typically moves over a particular period.
Unlike trend indicators, ATR does not identify whether the market is bullish or bearish. Instead, it measures the magnitude of price movement.
An ATR stop-loss strategy uses this volatility measurement to determine how much room a trade should have before its stop loss is triggered.
The basic concept is straightforward:
This creates a more flexible approach to stop placement.
Instead of asking how many pips should be used for every trade, traders can consider how much the market is currently moving.
Before using ATR for stop-loss placement, it is important to understand how the indicator works.
ATR is calculated using the True Range (TR), which considers three possible measurements:
The highest of these three values becomes the True Range for that candle.
ATR then calculates an average of True Range values over a selected period.
A commonly used setting is 14 periods.
For example, ATR calculated on a daily chart measures average volatility using daily price data, while ATR on an hourly chart measures volatility using hourly price data.
The important point is that ATR values depend on the timeframe and the instrument being analyzed.
A trader should therefore interpret ATR in the context of the chart being used.
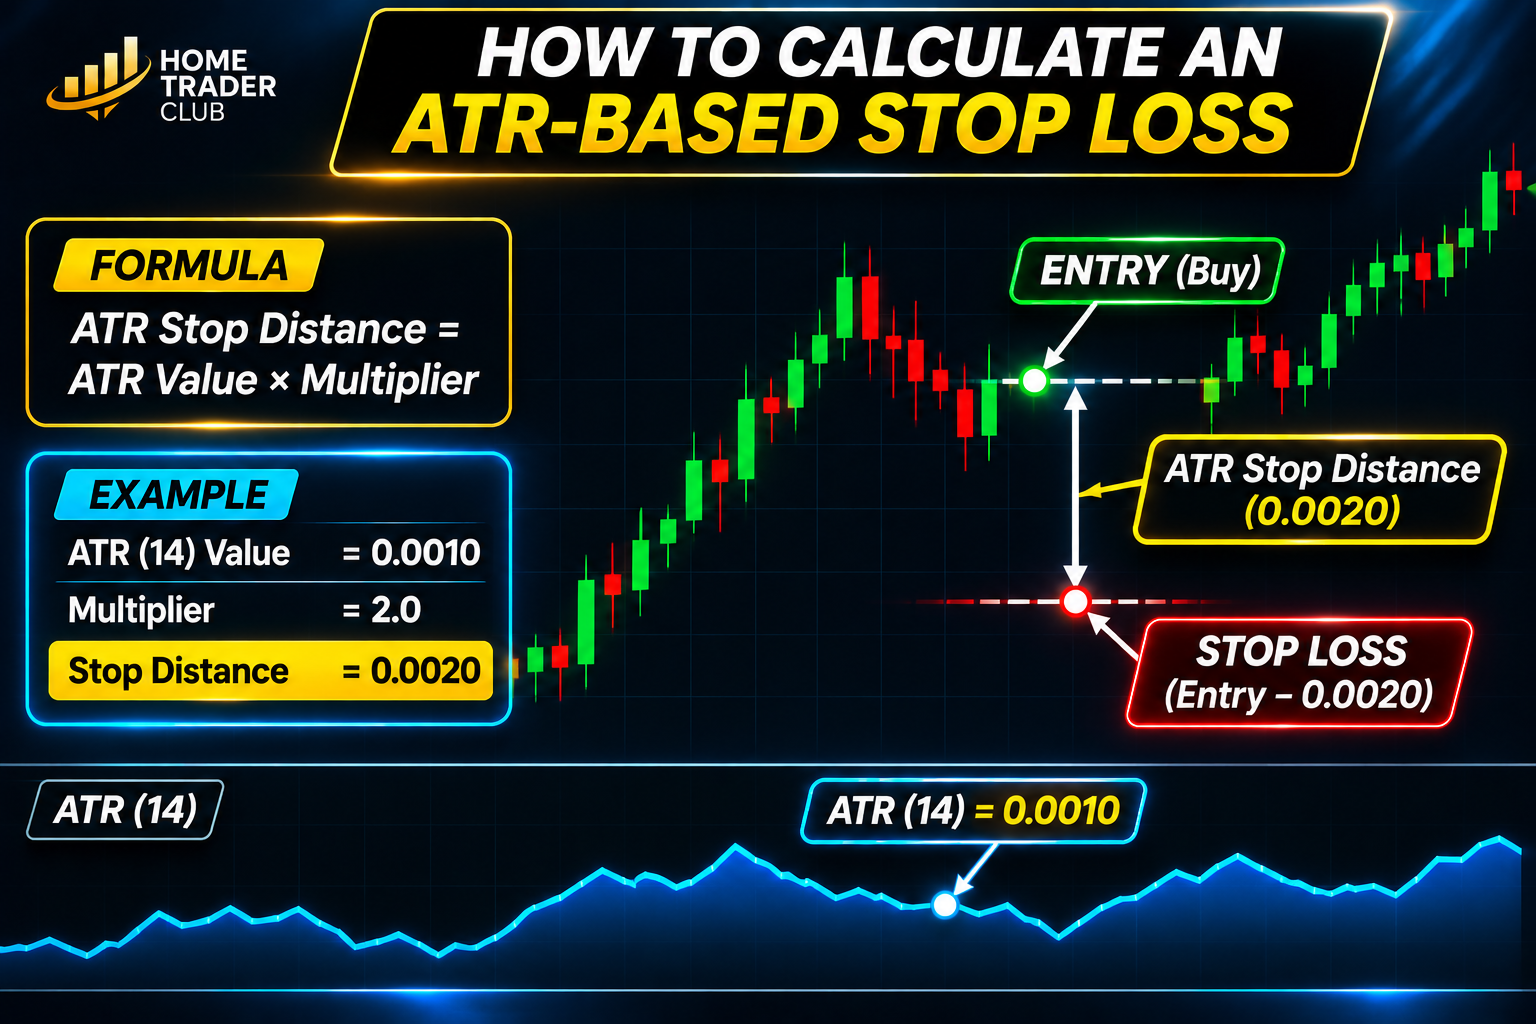
The simplest way to calculate an ATR-based stop loss is to multiply the current ATR value by a selected multiplier.
ATR Stop Distance = ATR Value × ATR Multiplier
The multiplier determines how much room the stop loss allows for normal market fluctuations.
For a long position:
Stop Loss = Entry Price − (ATR × Multiplier)
For a short position:
Stop Loss = Entry Price + (ATR × Multiplier)
The ATR value must be expressed in the same price units used for the entry price.
For example, if the ATR value is 0.0010 and the selected multiplier is 2, the calculated stop distance is 0.0020.
The stop-loss distance is therefore twice the measured ATR value.
This is a volatility-based calculation, not a guarantee that the stop will be positioned beyond meaningful technical support or resistance.
Traders should also consider the market structure before deciding whether the calculated level is suitable.
Selecting an appropriate ATR multiplier is one of the most important parts of an ATR stop-loss strategy.
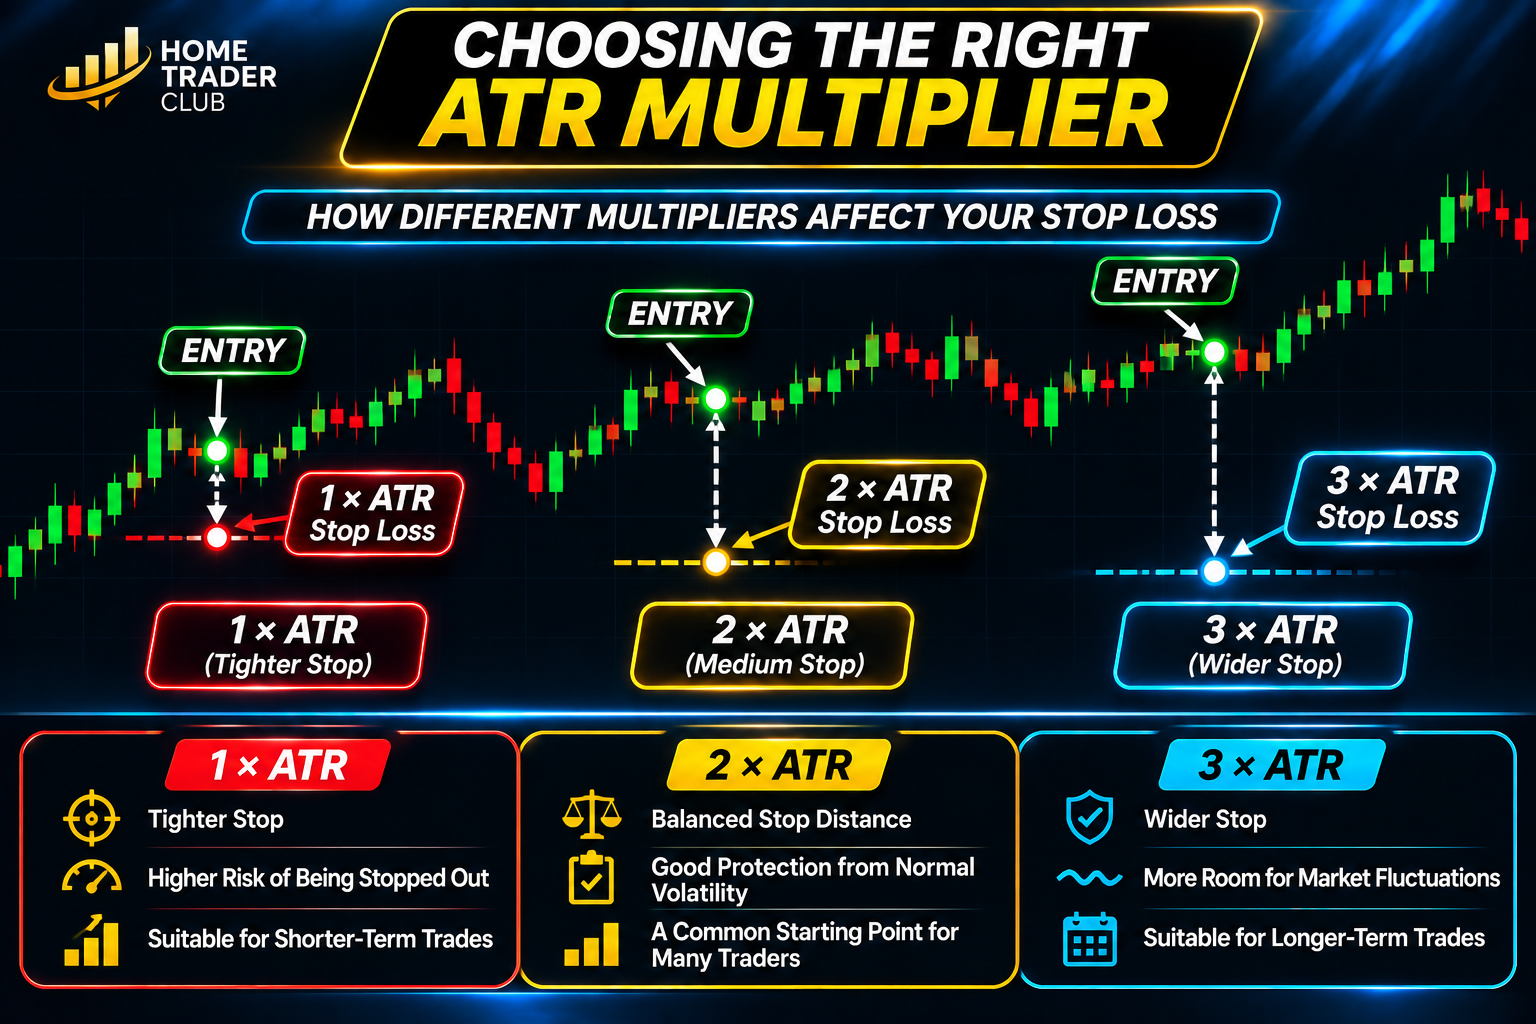
A smaller multiplier creates a tighter stop, while a larger multiplier allows more room for price fluctuations.
Common multiplier settings include:
A one-times ATR multiplier creates a relatively tight stop.
It may be suitable for strategies that use shorter holding periods or require closer risk control. However, the stop may be more vulnerable to ordinary price fluctuations, particularly during volatile conditions.
A 1.5-times ATR multiplier provides additional room compared with a one-times setting.
It can be considered when a trader wants to balance stop distance and protection against normal volatility.
A two-times ATR multiplier is a commonly tested starting point for volatility-based stop placement.
It allows a wider distance than the smaller multipliers, although it also increases the amount of price movement permitted before the stop is reached.
A three-times ATR multiplier creates a considerably wider stop.
It may be useful for strategies designed to tolerate larger price fluctuations and longer holding periods. However, the wider distance requires appropriate position sizing to keep monetary risk controlled.
There is no universally correct ATR multiplier.
The most suitable setting depends on the trading strategy, timeframe, instrument, market conditions and acceptable risk.
Rather than choosing a multiplier simply because it is popular, traders should test different settings using historical data and evaluate their performance under different market environments.
Fixed stop-loss distances are easy to understand and implement.
However, they have one important limitation: they do not automatically adapt to changes in market volatility.
Consider the difference between a relatively quiet market and a highly volatile market.
During quieter conditions, a fixed stop distance may be unnecessarily wide.
During volatile conditions, the same stop distance may be too narrow to accommodate normal price fluctuations.
This can result in inconsistent stop placement.
An ATR-based approach attempts to address this issue by adjusting the stop distance according to recent volatility.
However, this does not mean ATR stops are automatically superior to fixed stops.
A fixed stop may be perfectly suitable for a strategy with clearly defined technical invalidation levels. The important consideration is whether the stop placement matches the strategy being used.
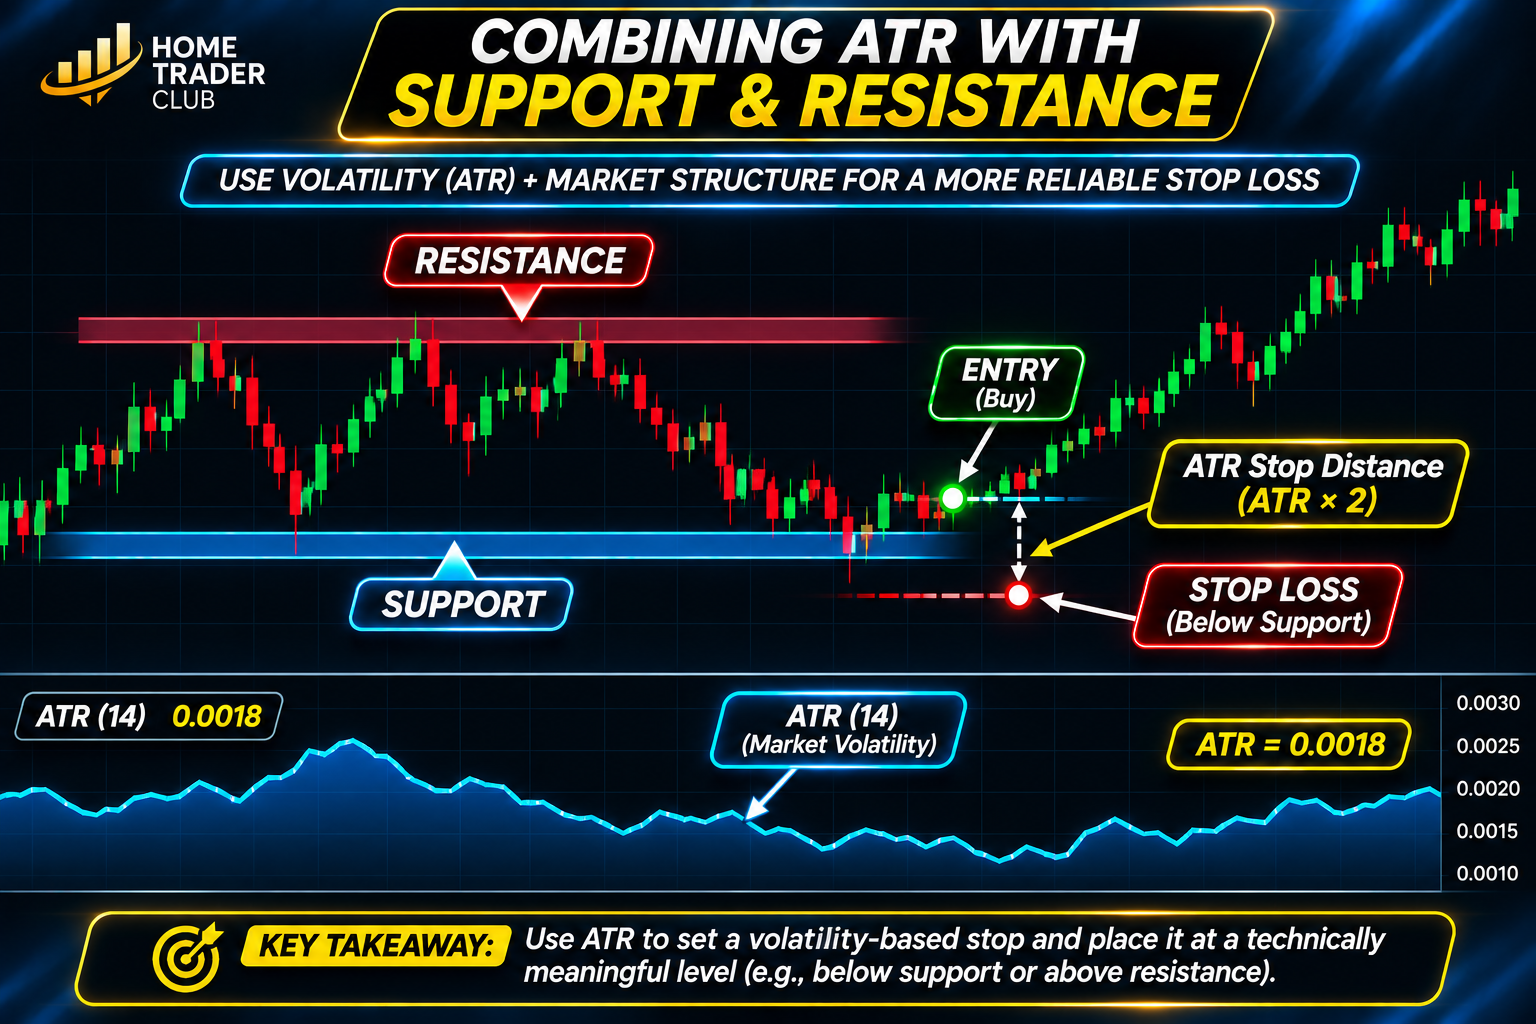
One of the most effective ways to improve ATR-based stop placement is to combine volatility measurements with technical market structure.
ATR measures how much the market moves, but it does not identify important price levels.
Support and resistance analysis provides additional information about where the market may encounter buying or selling pressure.
A trader can use ATR to assess whether a proposed stop distance provides sufficient room around an important technical level.
For example, when planning a long position, the trader may identify a relevant support area and evaluate whether the stop loss allows enough room beneath that area.
For a short position, the same process can be applied around a relevant resistance area.
The objective is to avoid placing stops solely according to an indicator calculation without considering the structure of the market.
A technically meaningful stop should reflect the conditions that would invalidate the original trading idea.
ATR can help measure the distance required, while market structure helps determine where the stop may make technical sense.
This is an especially important part of volatility-based risk management.
A wider stop loss should generally result in a smaller position size if the trader wants to maintain the same monetary risk.
Likewise, a narrower stop distance may allow a larger position size while maintaining the same predefined risk amount.
The basic position-sizing relationship is:
Position Size = Monetary Risk ÷ Monetary Risk Per Unit of Price Movement
The monetary risk per unit depends on the stop-loss distance, instrument specifications, contract size and account currency.
Consider the following general principle:
This is why ATR should not be considered only a stop-loss indicator. It can also contribute to a more consistent position-sizing process.
A common mistake is to increase the stop distance when volatility rises but keep the same lot size.
Doing so increases the potential monetary loss.
The purpose of volatility-adjusted position sizing is to prevent this inconsistency.
ATR can be applied to different chart timeframes, but traders should understand that the value changes according to the timeframe selected.
A shorter timeframe generally measures shorter-term price fluctuations, while a higher timeframe captures movement over longer periods.
For example:
The timeframe used for ATR should be consistent with the timeframe of the trading strategy.
Using an ATR value from an unrelated timeframe without a clear reason can produce stop distances that do not properly reflect the trade’s intended holding period.
Traders who use multiple timeframes can also compare volatility across those timeframes to understand whether short-term market activity is unusually high or low relative to the broader environment.
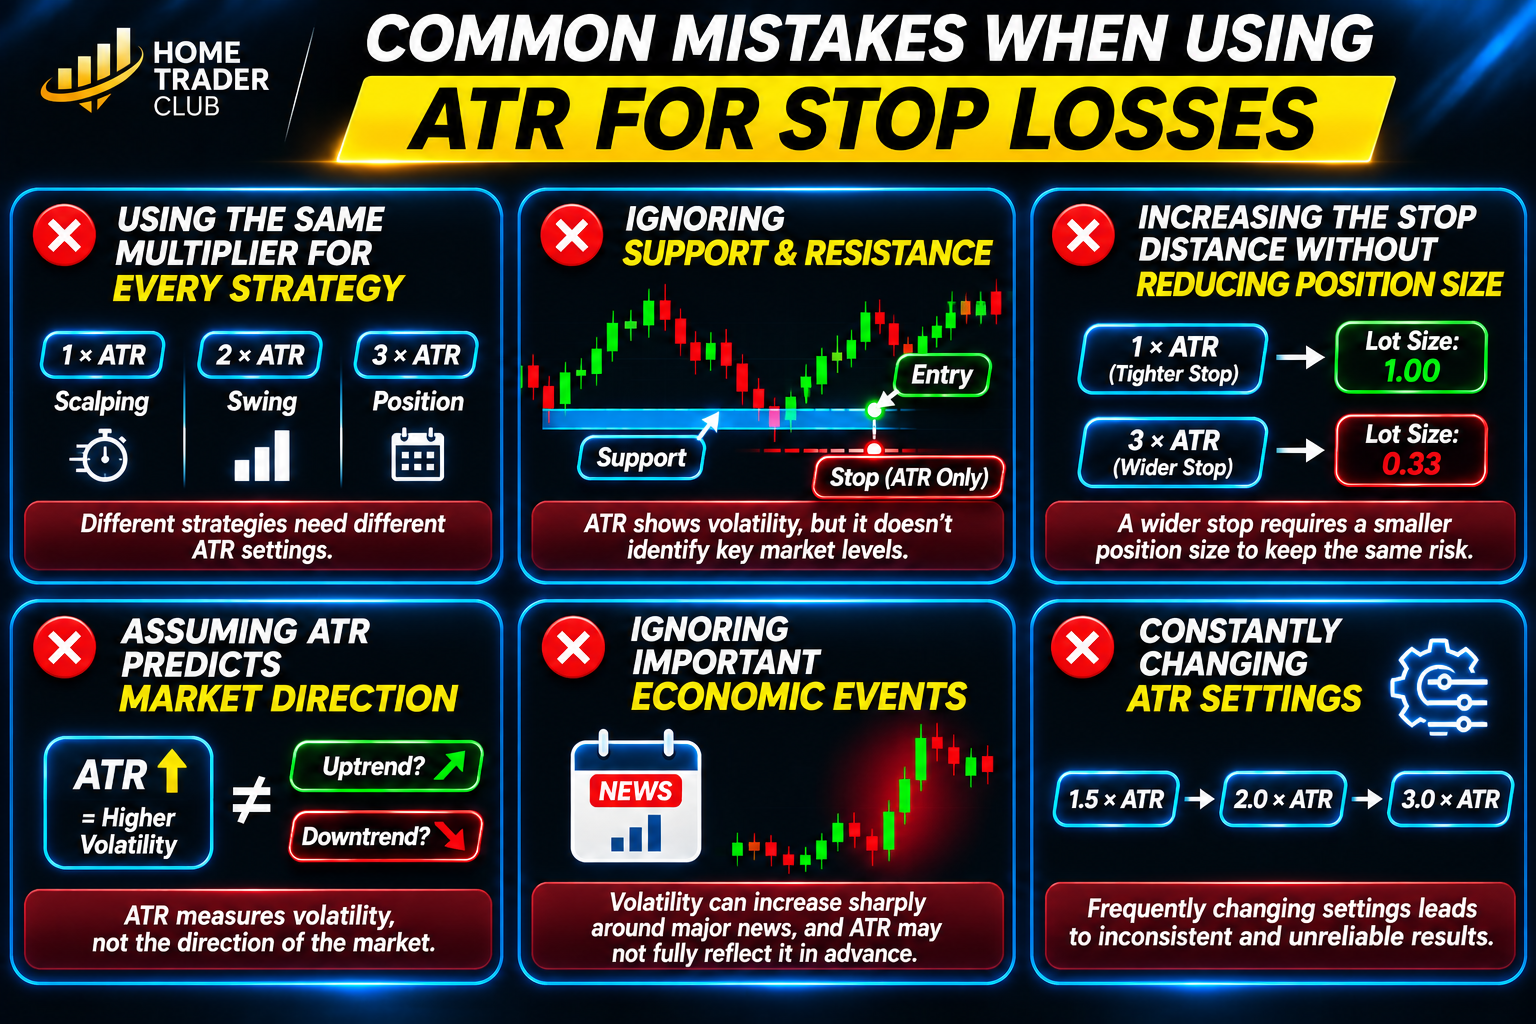
Although ATR is a useful volatility measurement, it can be misused.
Here are some common mistakes traders should avoid.
Different trading strategies have different objectives and holding periods.
A multiplier that works well for one strategy may not be appropriate for another.
ATR settings should be tested according to the strategy rather than applied universally.
ATR does not identify technical invalidation levels.
Placing a stop purely according to an ATR calculation can result in a technically inappropriate stop location.
Market structure should remain part of the decision-making process.
This is a significant risk-management mistake.
A wider stop combined with an unchanged position size increases the potential monetary loss.
Position sizing must account for the actual stop distance.
ATR measures volatility, not direction.
An increase in ATR does not automatically indicate that the market will move higher or lower.
Traders should use other forms of technical or fundamental analysis to assess market direction.
Market volatility can change rapidly around important economic announcements and unexpected developments.
ATR is calculated using historical price data and may not fully reflect an upcoming volatility event.
Traders should remain aware of the economic calendar and understand that slippage and price gaps can cause execution at a level different from the intended stop price.
Frequently adjusting multipliers in response to recent winning or losing trades can lead to inconsistent trading decisions.
A strategy should be evaluated over a meaningful historical sample rather than repeatedly modified because of short-term outcomes.
Backtesting is essential before implementing an ATR-based stop-loss method with real capital.
A structured testing process should include:
1. Define the trading strategy
Establish the entry rules, market conditions, timeframe and exit conditions before testing stop-loss settings.
2. Select ATR settings
Choose a consistent ATR period and test several multipliers.
3. Maintain consistent risk rules
Use position sizing that adjusts according to the stop distance, keeping the intended monetary risk consistent.
4. Evaluate different market conditions
Test the strategy during trending markets, ranging markets, high-volatility periods and quieter conditions.
5. Compare performance
Review important measurements, including:
6. Validate the results
Avoid selecting a multiplier simply because it produced the highest historical profit.
A setting that performs exceptionally well on one historical sample may not perform similarly in future market conditions.
Forward testing and ongoing performance monitoring can help assess whether the approach remains suitable.
A structured approach is more useful than relying on a single indicator setting.
Traders can follow these principles:
The objective is not to find a stop-loss setting that prevents every losing trade.
No stop-loss method can achieve that.
The objective is to establish a repeatable framework in which stop placement, market volatility and position sizing work together.
The ATR stop-loss strategy provides Forex traders with a practical way to adapt stop distances to changing market volatility.
Instead of relying entirely on fixed pip values, traders can use the Average True Range to estimate how much room a position may require under current market conditions.
However, ATR should not be used in isolation.
Combining ATR with support and resistance, market structure, appropriate position sizing and disciplined risk management can create a more structured approach to stop-loss placement.
Remember that a wider stop does not automatically make a trade safer, and a tighter stop does not automatically improve risk management.
What matters is whether the stop location makes sense for the trading strategy and whether the position size keeps potential losses within acceptable limits.
Successful trading is not about avoiding every loss. It is about managing risk consistently, protecting trading capital and following a well-tested trading plan.
To Your Trading Success,
Vladimir Ribakov
Internationally Certified Financial Technician (CFTe)
Home Trader Club
Forex and CFD trading involve significant risk and may not be suitable for every investor. Leverage can amplify both profits and losses, and traders may lose some or all of their invested capital. ATR-based stop-loss calculations do not guarantee execution at the intended price, particularly during periods of low liquidity, slippage or market gaps. The information in this article is provided for educational purposes only and should not be considered financial or investment advice. Always assess your financial circumstances and risk tolerance before trading.
The financial markets are entering another potentially volatile week, with several interesting technical developments creating…
Why Consumer Confidence Matters in Forex Trading When analyzing the Forex market, traders often pay…
When traders study the Forex market, they often focus on economic indicators such as inflation,…
The markets are showing some fascinating technical developments this week, and there are several opportunities…
When Being Right Becomes More Important Than Making Money Every Forex trader wants to make…
Why Doesn't a Strong Economy Always Have a Strong Currency? Imagine that a country reports…