Hi Traders! CHFJPY forecast update and follow up is here. On October 8th I shared this “CHFJPY Technical Analysis And Forecast” post in my blog. In this post, let’s do a recap of this setup and see how it has developed now. If you would like to learn more about the way we trade and the technical analysis we use then check out the Traders Academy Club. Spoiler alert – free memberships are available!
My Idea:
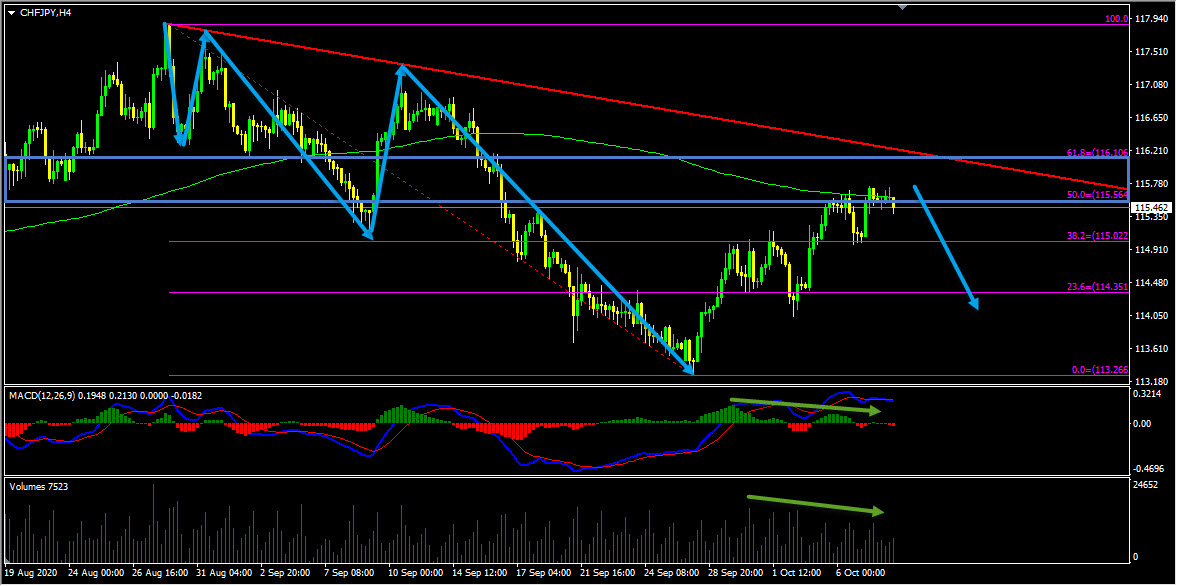
On the H4 chart, the price which was moving lower has created a bearish trend pattern in the form of three lower highs, lower lows. Generally, after a bearish trend pattern, we may expect corrections and then further continuation lower. Currently, it looks like the correction that we are looking for is happening. The price which is moving higher has reached a key resistance zone formed by the 50%(115.564) – 61.8%(116.106) fibonacci retracement zones of the bearish trend pattern. We also have the daily downtrend line and the 200 moving averages coinciding in the same area. In addition to this we have a bearish divergence that has formed between the first high that has formed on 29th September 2020 and the second high that has formed on 7th October 2020 based on the MACD indicator. Also, the volumes are dropping based on the Volumes indicator, and based on the 200 moving averages the slope is bearish, we may consider these as evidences of bearish pressure. So until the key resistance zone shown in the screenshot below (marked in blue) holds my view remains bearish here and I expect the price to continue lower further.
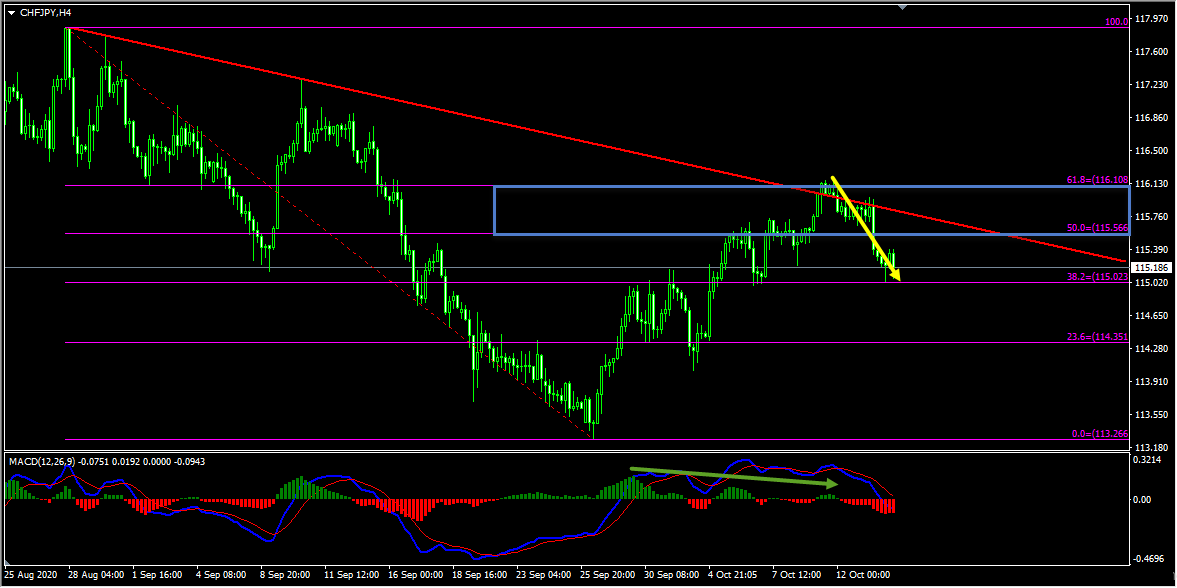
On the H4 chart, the price action followed my analysis exactly as I expected it to. The price which was moving higher reached the key resistance zone, respected it and moved lower from this zone. The market provided us with various facts supporting the bearish view here, the first one we had here is the bearish divergence that has formed between the first high that has formed on 29th September 2020 and the second high that has formed on 10th October 2020 based on the MACD indicator. Then we also had a false break of the downtrend line (marked in red) which we may consider as another fact provided by the market supporting the bearish view.
(Note: You can learn about a Killer Forex Strategy “Double Trend Line Principle” here)
For similar trade ideas and much more join the Traders Academy Club and get access to our complete watch list and trade report.
This is how the report looks like. A table with the hottest market opportunities, screenshot behind every pair and time frame (anything that is in blue inside the table is clickable and leads to a screenshot) + a summary in text format, kind of highlights. And of course, Live Market Analysis every single day.
If you have any further questions, don’t hesitate to drop a comment below!
Happy Trading!
Yordan Kuzmanov
Chief Trader at the Traders Academy Club
Hi Traders! USDCHF short term forecast update and follow up is here. On May 20th,…
Hi Traders! CADCHF short term forecast and technical analysis is here. We do our analysis…
The dollar was broadly steady on Monday as cautious investors watched out for signals on…
Hi Traders! Arvinth here from the Home Trader Club team. The weekly summary and, review of July…
European markets edged lower on Thursday following more overnight volatility in Asia’s tech-dominated indexes, while…
Hi Traders! EURGBP short term forecast and technical analysis is here. We do our analysis…