Hi Traders! EURCHF short term forecast update and follow up is here. On April 29th I shared this “EURCHF Short Term Forecast And Technical Analysis” post in our blog. In this post, let’s do a recap of this setup and see how it has developed now. If you would like to learn more about the way we trade and the technical analysis we use then check out the Traders Academy Club. Spoiler alert – free memberships are available!
My Idea:
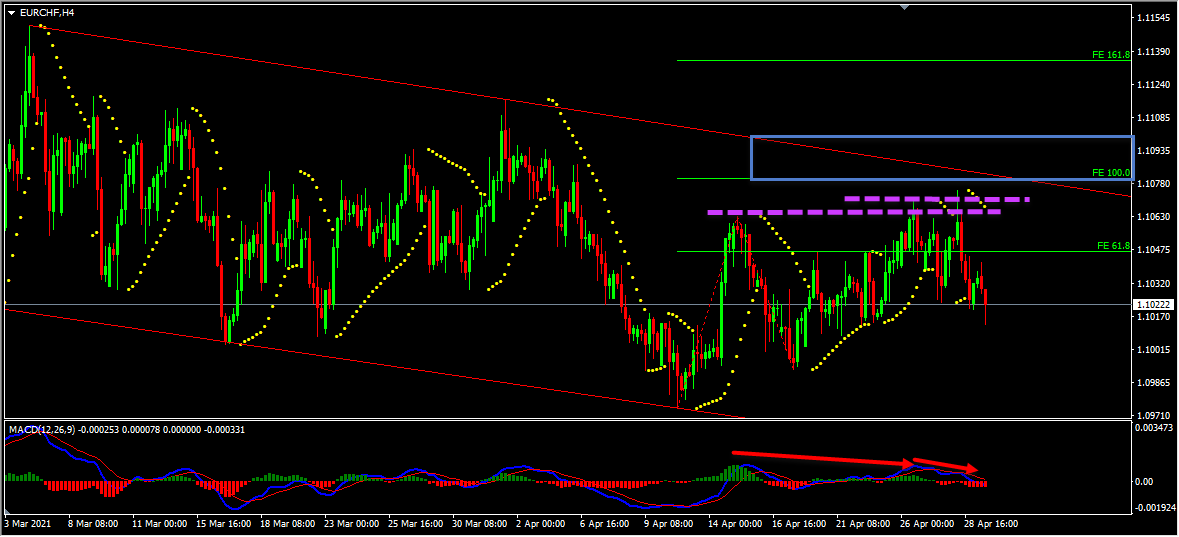
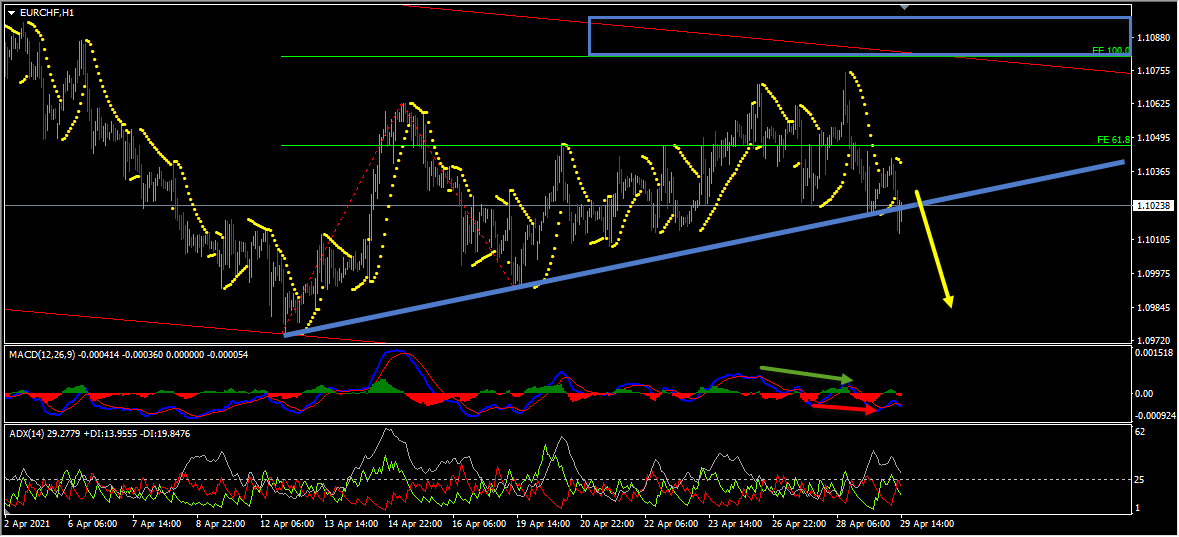
On the H4 chart the price is moving inside a range which started on 4th March 2021. This range is formed by the highs and lows reaching parallel support and resistance zones. The price which is moving inside this range has currently reached the top of it and is moving lower. The price has created multiple false breaks and bearish divergences between the first high that has formed on 15th April 2021 and the second high that has formed on 28th April 2021 which we may consider as evidences of bearish pressure. Also based on the Parabolic Sar we could see that the dots are above the price which we may consider as another evidence of bearish pressure. Also we have a key resistance zone that has formed based on the 100% (1.10805) Fibonacci expansion level of the first wave and the top of the range. The price which was moving higher, respected this zone and is bouncing lower from this zone. Until this key resistance zone holds my view remains bearish here. So everything looks good here for the bears and we may now move down to lower timeframe and look for evidences supporting this bearish view.
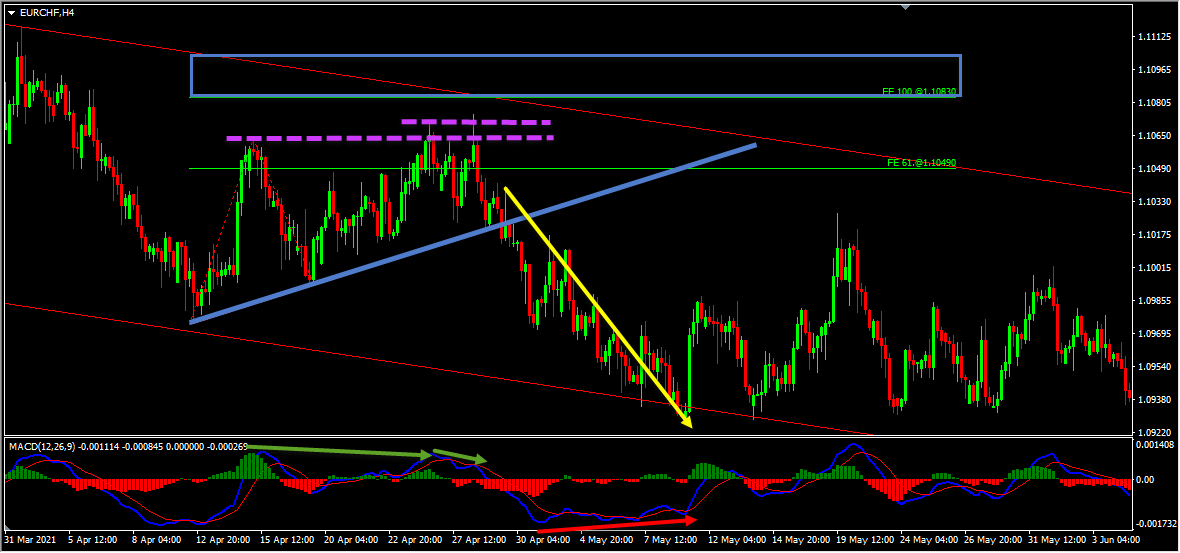
Based on the above-mentioned analysis my short term view was bearish here and I was expecting the price to move lower towards the bottom of the range. The price action followed my analysis exactly as I expected it to here, the market has already provided us facts supporting the bearish view in the form of multiple false breaks with multiple bearish divergences. In addition to this the price was holding below the key resistance zone formed by the 100%(1.10830) Fibonacci expansion level of the first wave and the top of the range. Also, the price which was moving lower broke below the most recent uptrend line which we may consider as yet another fact provided by the market supporting the bearish view. The price then moved lower further and reached the bottom of the range, delivering around 100 pips move until it was blocked by a bullish divergence.
Not sure how to enter a trade? Spot reversals (bounces)? Not sure how to spot breakouts?
I invite you to join us in our live market analysis, on daily basis, and improve your trading with us.
Also, you can get one of our strategies free of charge. You will find all the details here
If you have any further questions, don’t hesitate to drop a comment below!
To your success,
Vladimir Ribakov
Certified Financial Technician
The new trading week presents several high-probability opportunities across the forex and commodities markets. After…
Hi Traders! Arvinth here from the Home Trader Club team. The weekly summary and, review of July…
Hi Traders! UK100 short term forecast and technical analysis is here. We do our analysis…
Hi Traders! CADCHF short term forecast follow-up and update is here. On May 14th 2026…
Hi Traders! EURNZD short term forecast and technical analysis is here. We do our analysis…
Hi Traders! AUDCAD short term forecast update and follow up is here. On May 12st…