Hi Traders! EURJPY short term forecast follow up and update is here. On March 26th I shared this “EURJPY Short Term Forecast”. This trade moved as per our plan and provided us wonderful returns and gets added to my list of successful trades. If you would like to learn more about the way we trade and the technical analysis we use then check out the Traders Academy Club. Spoiler alert – free memberships are available! In this post lets do a recap of this setup and see how it developed.
Missed this trade?
Never miss a trade opportunity again! Join the Traders Academy Club
Now lets summarize the idea first:
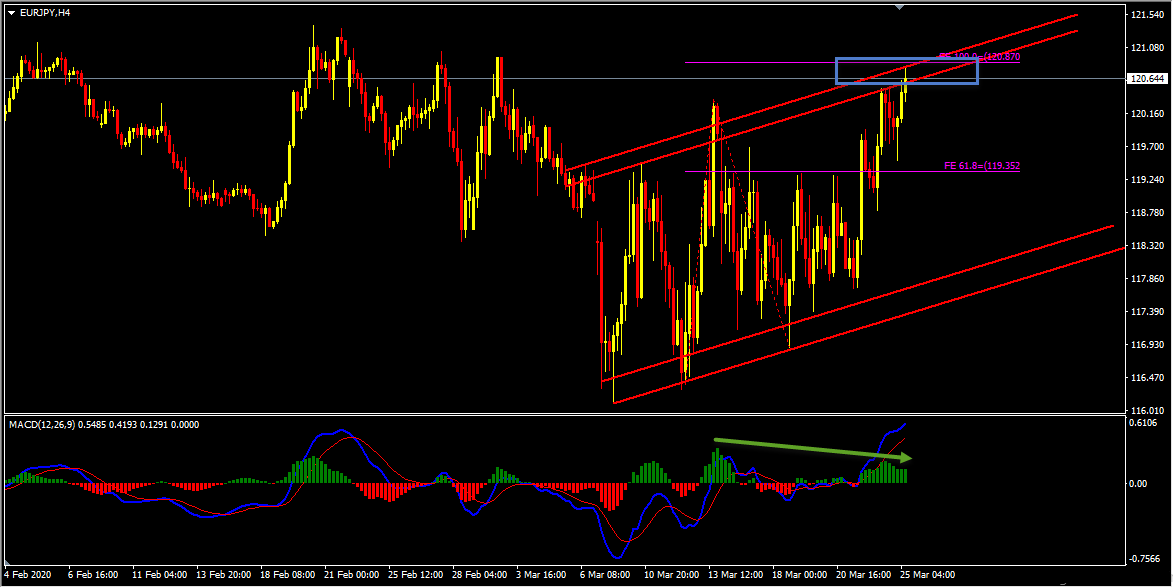
Bullish Channel, Important Resistance Zone, Bearish Divergence
Bearish Divergence, Strong Resistance Zone. Until this resistance zone holds my short term view remains bearish here, if the price moves lower and breaks below the low at 119.508 (marked in blue line) it would then open the door for the bears.
Based on the above mentioned multi-timeframe analysis my short term view was bearish here and I mentioned that “Until this resistance zone holds my short term view remains bearish here, if the price moves lower and breaks below the low at 119.508 (marked in blue line) it would then open the door for the bears”. The price didn’t move lower and break below the low at 119.508 as expected instead it moved higher reached the resistance zone again and created one more false break. We already have a bearish divergence, then the price moved lower and broke below the low at 120.105 thus creating lower lows, which we may consider as an evidence of bearish pressure. Currently it looks like a retrace is happening, my view remains the same here, until the resistance zone holds my short term view remains bearish in this pair.
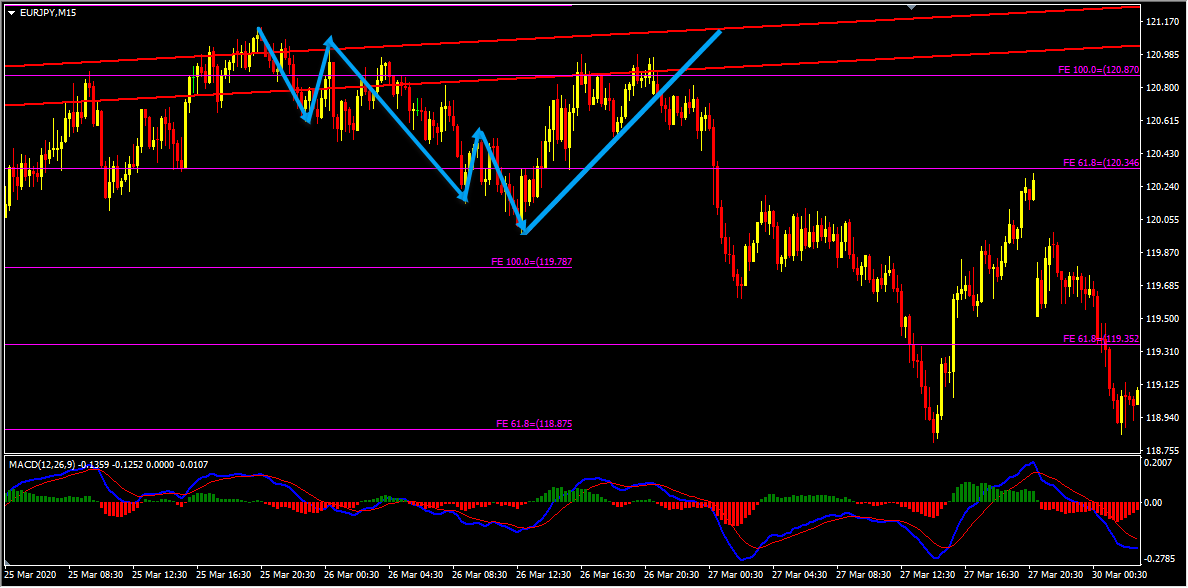
It is very important to validate the setup before we enter the trade. Here in this case the price reached an important resistance zone and was respecting it, the price then created a bearish convergence as shown in the above chart which we may consider as an evidence of bearish pressure. While checking on the lower timeframe (M15 chart) we could see that we had a bearish trend pattern followed by a double wave correction and then the price has broken below the most recent uptrend line which we considered as another evidence of bearish pressure.
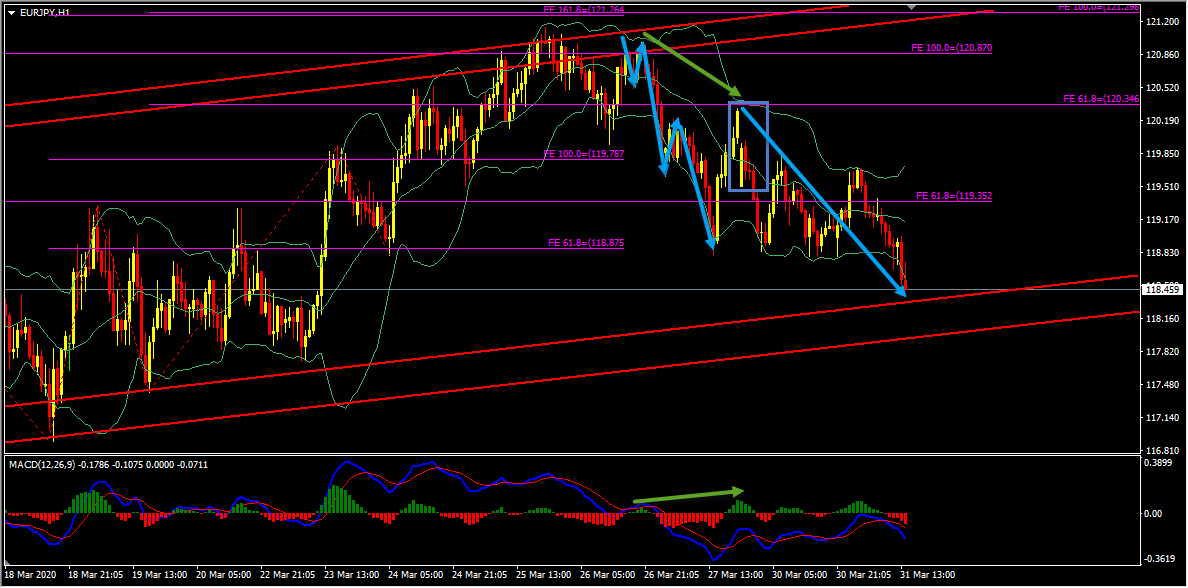
We then had a good down move with the price creating a bearish trend pattern on the H1 chart, then the price retraced back again, it reached the upper boundary of the Bollinger Band where we had a hidden bearish divergence that has formed between the first high that has formed on 26th March 2020 and the second high that has formed on 27th March 2020 based on the histogram of the MACD indicator, in addition to this we also had a gap with a Marubozu candlestick pattern we may consider these as evidences of bearish pressure. All these evidences validated the bearish view, the price then moved lower further as expected and provided us amazing profits!
Right now with the Corona virus impact the real money flow is not there in the market, a lot of investors and traders are out of the market and are waiting for this crisis to come down. Many traders are sitting on the fence making nothing, what you would see on the market in such period in panics, there are a lot of random fast moves with high volatility, very serious moves, big volumes but these moves are not technical but in such cases its very important to wait for your setups, have your analysis.
If the setup comes, trade it just like we did in this EURJPY trade and we valued the risk with this trade, we had a proper money management plan. In such high volatility period if you would be right then once the price moves, it moves big and fast but if it doesn’t then you know your risk is limited. Don’t trade without planning your risk its a big mistake. In this case we were right and we got wonderful big and fast moves which has provided us fantastic profits. This trade is good example of how to trade in such high volatility conditions and how to validate your setup before entering the trade.
Watch my video on How to trade during Corona virus Crisis here
For similar trade ideas and much more join the Traders Academy Club and get access to our complete watch list and trade report.
This is how the report looks like. A table with the hottest market opportunities, screenshot behind every pair and time frame (anything that is in blue inside the table is clickable and leads to a screenshot) + a summary in text format, kind of highlights. And of course Live Trading Room every single day.
If you have any further questions, don’t hesitate to drop a comment below!
To your success,
Vladimir Ribakov
Certified Financial Technician
The new trading week presents several high-probability opportunities across the forex and commodities markets. After…
Hi Traders! Arvinth here from the Home Trader Club team. The weekly summary and, review of July…
Hi Traders! UK100 short term forecast and technical analysis is here. We do our analysis…
Hi Traders! CADCHF short term forecast follow-up and update is here. On May 14th 2026…
Hi Traders! EURNZD short term forecast and technical analysis is here. We do our analysis…
Hi Traders! AUDCAD short term forecast update and follow up is here. On May 12st…