In the first and second part of the “Most powerful candlestick patterns” I have covered some of the best, most reliable and my personal candlestick patterns. I really hope that you took the time after each article to go to the chart and “play” with those patterns. The patterns work better in some situations and worse in others. Applying the extra filters like divergences, trend lines, support/resistance zones and so on will improve dramatically your success rate.
Remember that trading is a business of statistics and the better odds you create for yourself, the better the results will be. And yes, you “create” the odds yourself to a certain extent by being picky and conservative in your trading.
Recap
Let’s quickly review the 4 patterns from the previous two posts – The Marubozu, Engulfing, Hatchet and Equal Shadows.
Marubozu
Type of the pattern: Reversal.
Success Rate: 80-90% (best scenario where extra confirmations are applied).
TF Performance: The higher the TF the more reliable the pattern is.
Categories: Complete Marubozu, Closing Marubozu, Opening Marubozu
Description: The complete marubozu pattern has not wigs (shadows) from either side of the candle. The pattern appears at the end of a trend signifying desperate tries of the bears or the bulls to continue the trend but usually once the pattern appears price will reverse within a few bars. Very often we will see one last spike in the direction of the trend after the marubozu pattern.
Engulfing
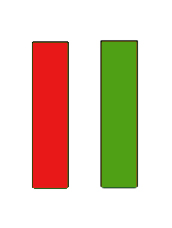
ype of the pattern: Reversal.
Success Rate: 70-80% (best scenario where extra confirmations are applied) .
TF Performance: The higher the TF the more reliable the pattern is.
Categories: Bullish, Bearish
Description: The pattern is known to appear at the end of a trend. When price reaches a certain level and the momentum is exhausted buyers or sellers would close their positions in effort to collect profits. At this point the current candle would engulf the previous candle(s) completely showing very strong momentum in the opposite direction of the current trend. This is indeed the sign that the trend is over and we can expect a reversal to occur.
EQUAL SHADOWS
Type of the pattern: Reversal/Continuation
Success Rate: N/A
TF Performance: The higher the TF the more reliable the pattern is.
Categories: Bullish, Bearish
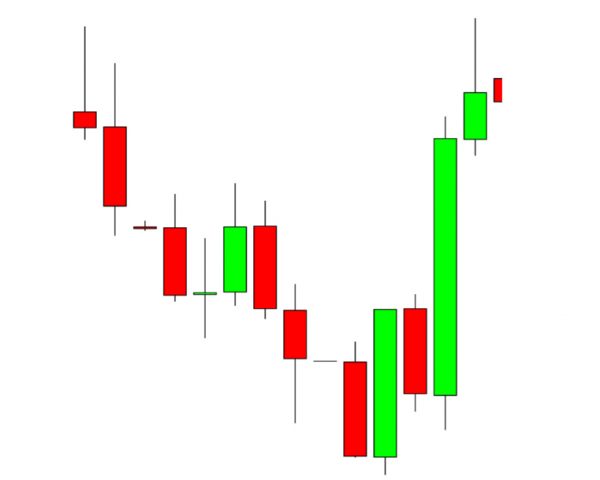
Description: The pattern shows a very strong momentum usually a reversal but if found during a correction it could be used as continuation pattern. It is very distinctive with its almost equal shadows from both sides of the body.
Hatchet
Type of the pattern: Reversal
Success Rate: 65-75%
TF Performance: The higher the TF the more reliable the pattern is.
Categories: Bullish, Bearish
Description: This pattern reminds a lot the hammer pattern which is a very well know trading formation. The only difference between the two is that the Hatchet pattern will close without a wig above the body when bullish and below the body when bearish. This signifies a very strong momentum and a great reversal chance.
Today I would like to introduce you to the Kicker pattern and the Harami pattern. First one is a reversal pattern, while the second one is most likely to be found inside a corrective phase of the market, forecast a further continuation of the underlying trend.
The Kicker Pattern
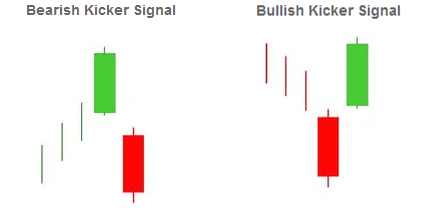
The Kicker is a pattern that consist of two candles. It is one of the most powerful patterns you will ever use and naturally it is not very common. It works equally well in either direction (bullish/bearish). You will find the pattern very accurate when it occurs in an oversold or overbought area. To determine such areas on your chart you might use Oscillator Indicators like RSI, Stochastic etc.
Why does the Kicker Pattern appears?
This formation shows a significant change in the market sentiment. Often this occurs due to some surprise news that hits the market, causing the massive change in sentiment. If the trend was bullish, a bearish kicker would appear, creating a gap down. It is important that the upper wig of the bearish kicker doesn’t enter the territory of prior bullish candle’s body.
Same applies for the bullish kicker. Even though it is not a necessity for the pattern to appear at the end of a trend most times it would. The bullish kicker would gap up as shown in the image above.
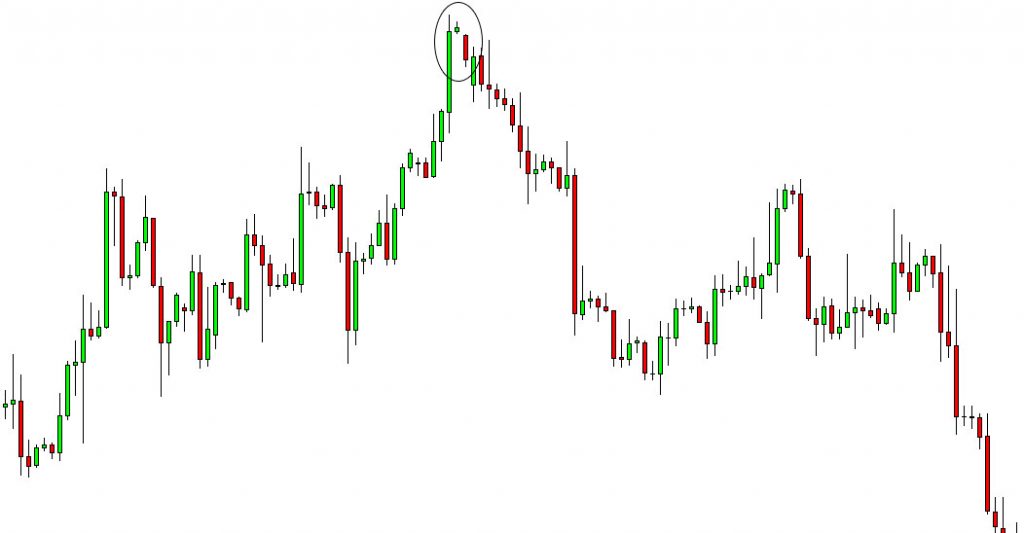
Let’s see an example of a real world setup:
Bullish kicker appearing at the end of an uptrend
Trading the Kicker
Feel free to jump in right away once the kicker pattern appears. Some traders wait for extra confirmations like further continuation after the kicker candle (up if bullish and down if bearish). As mentioned above the pattern doesn’t appear very often due to it’s nature. The sentiment switching so obvious and strong is not very often so if you wait for confirmation you might miss out on a great opportunity.
Protection should be placed below the previous candle’s low or above the previous candle’s high in the case of a bearish kicker. Always aim for at least 1:2 risk:reward even though it might be a wise idea to collect only partially once the price deliver’s the 1:2 R:R and let the other part run. Remember that this pattern represent a significant change in the given market’s sentiment and a strong opposite trend is expected.
In conclusion – this is considered to be one of the most powerful and accurate reversal candlestick patterns. Cherish it and respect it as it will pay off. Now let’s go over the Harami Pattern.
Harami
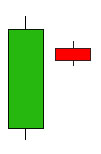
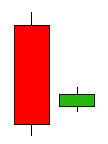
The Harami (by the way meaning “pregnant” in Japanese) is a reversal pattern. Fairly even to spot and quite reliable the Harami will become one of your favorite patterns. The pattern itself consists of two candles. Let’s define the bearish and the bullish harami:
Bearish Harami –
It forms when there is a large green candle, followed by a smaller red candle which is completely inside the body of the first candle. This way the two candles create the illusion of a pregnant woman – first candle being the mother, second one being the baby.
Bullish Harami –
A bullish Harami occurs when there is a significantly larger red candle that is followed by a smaller green candle which is completed engulfed by the previous red one.
Why does the Harami Pattern appear?
“The Bullish Harami is a sign of disparity in the market’s health. The market is characterized by a downtrend and a bearish mood, and there is heavy selling reflected by a black body, which further supports the bearishness. However, the next day prices open higher or at the close of the preceding day and the short traders are alarmed. This leads to the covering of many short positions, causing the price to rise further. The latecomers short the trend they missed the first time, and slow down the rise. Thus, a small white body is formed. This may signal a trend reversal since the second day’s small real body shows that the bearish power is diminishing.”
That’s all for the third part, my dear reader. I hope that you are going to master all of the patterns explained in the recent posts – read part one HERE ( Marubozu and Engulfing), read part two HERE (Equal Shadows and The Hatchet). You can trade them alone but I strongly suggest you to trade them in liaison with another method/tool.
Have a great remaining of the weekend!
Yours,
Vladimir

