Hi Traders! GBPAUD short term forecast follow up and update is here. On November 17th I shared this “Technical Analysis – GBPAUD Short Term Forecast” post in our blog. In this post, let’s do a recap of this setup and see how it has developed now. If you would like to learn more about the way we trade and the technical analysis we use then check out the Traders Academy Club. Spoiler alert – free memberships are available!
My Idea
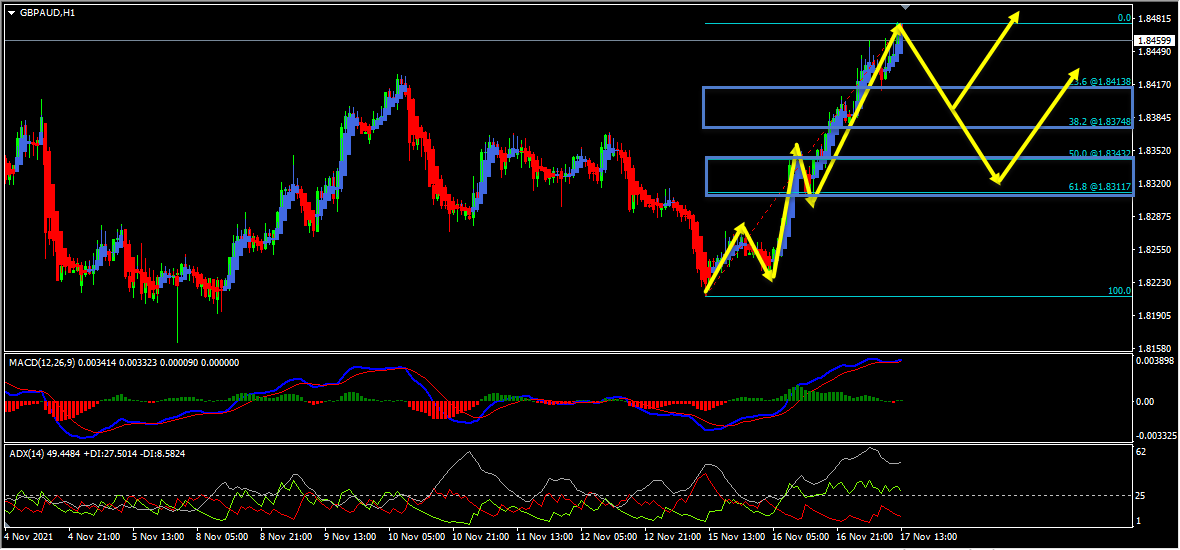
On the H1 chart, we could see that the price which is moving higher has created a bullish trend pattern in the form of three higher highs, higher lows which we may consider as evidence of bullish pressure. Also, based on the Heikin Ashi candles we can see that currently, we have strong bullish bodies in upward moving market conditions so it basically reflects a bullish environment. We may consider this as another evidence of bullish pressure. In addition to this, the ADX indicator gave a bullish signal here as well at the cross of +DI (green line) versus -DI (red line), and the main signal line (silver line) reads value over 25, we may consider this as yet another evidences of bullish pressure. While measuring the bullish trend pattern using the Fibonacci retracement tool, we have two key support zones that has formed. The first key support zone is formed by the 23.6%(1.84138) – 38.2%(1.83748) Fibonacci retracement levels and the second key support zone is formed by the 50%(1.83432) – 61.8%(1.83117) Fibonacci retracement levels. Until both these key support zones hold my short term view remains bullish here and I expect the price to move higher further.
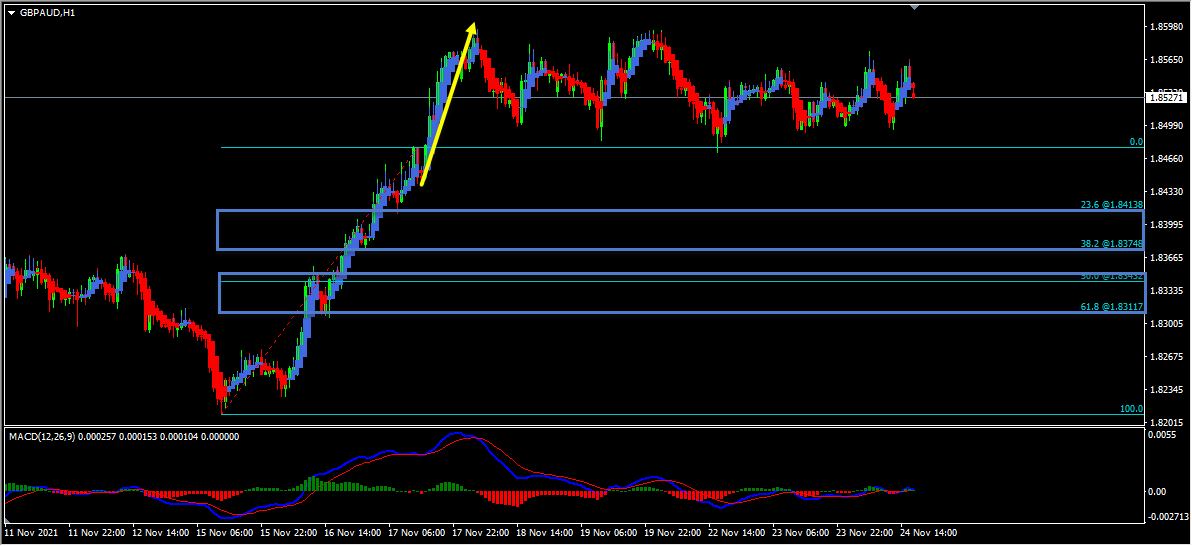
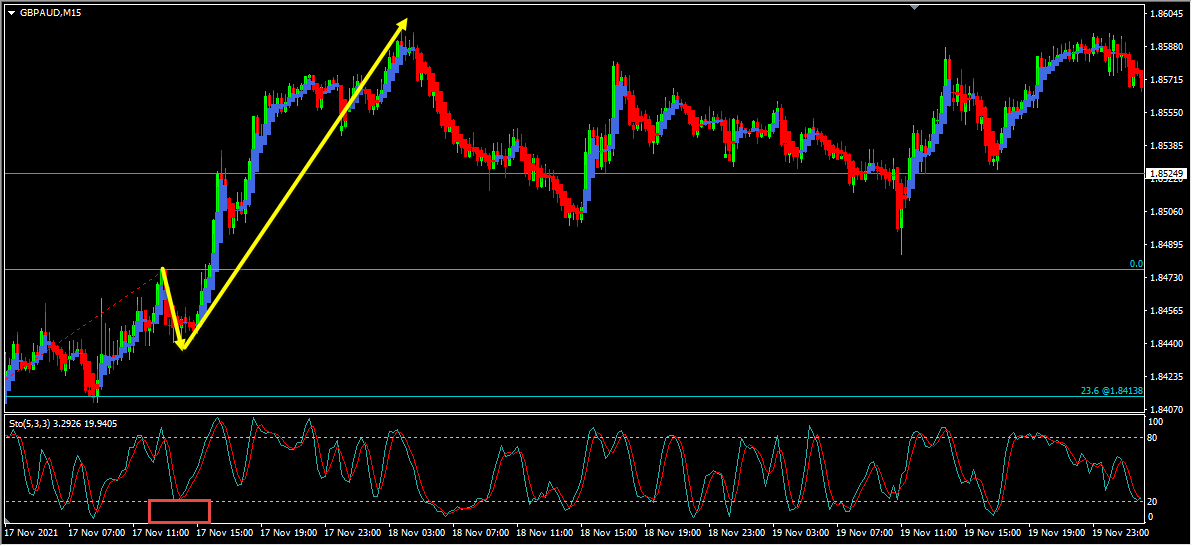
Based on the above-mentioned analysis my short term view was bullish here and I was expecting the price to move higher further until the two key support zones hold. After the bullish trend pattern, the deeper pullback towards the key support zones never happened, however smaller pullback did happen on the M15 chart. The price then moved higher further and has delivered around 160 pips move so far.
For similar trade ideas and much more I invite you to
Also, you can get one of our strategies free of charge. You will find all the details here
If you have any further questions, don’t hesitate to drop a comment below!
Happy Trading!
Arvinth Akash
Traders Academy Club Team.
U.S. stock indexes hit multi-week lows on Thursday, as concerns over heavy AI spending resurfaced…
Hi Traders! GBPUSD short term forecast and technical analysis is here. We do our analysis…
Hi Traders! Ethereum short term forecast follow-up and update is here. On May 26th, 2026…
Hi Traders! GBPAUD short term forecast and technical analysis is here. We do our analysis…
Hi Traders! USDCHF short term forecast update and follow up is here. On May 20th,…
Hi Traders! CADCHF short term forecast and technical analysis is here. We do our analysis…