Hi Traders! GBPAUD short term forecast update and follow up is here. On November 2nd I shared this “GBPAUD Short Term Forecast And Technical Analysis” post in our blog. In this post, let’s do a recap of this setup and see how it has developed now. If you would like to learn more about the way we trade and the technical analysis we use then check out the Traders Academy Club. Spoiler alert – free memberships are available!
My Idea
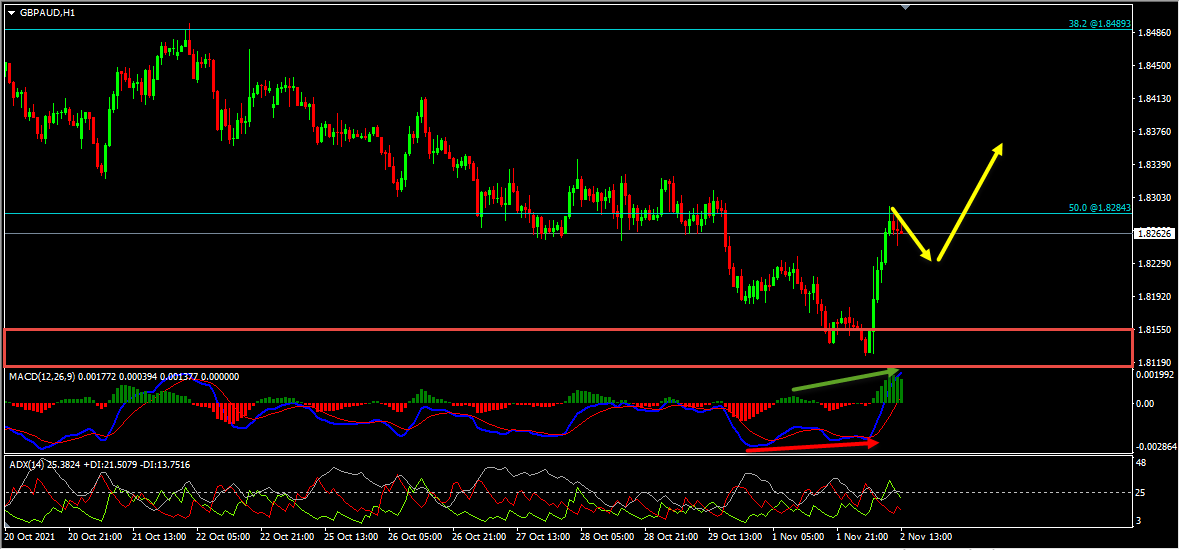
On the H1 chart, the price which was moving lower has reached a strong support zone, respected it and bounced higher from this zone. Also, we had a bullish divergence that has formed between the first low that has formed at 1.81849 and the second low that has formed at 1.81262 based on the MACD indicator. Then the price moved higher and broke above the last high at 1.82373 creating higher highs, thus forming a classical setup of bullish divergence followed by bullish convergence. Hence as per the book scenario, after a bullish convergence, we may look for corrections to happen and then further continuation to the upside. Currently it looks like a correction is happening. In addition to this, the ADX indicator gave a bullish signal here at the cross of +DI (green line) versus -DI (red line) and the main signal line (silver line) reads value over 25, we may consider this as yet another evidence of bullish pressure. So everything looks good here for the bulls and until the strong support zone shown in the image below holds, I expect the price to move higher further after pullbacks.
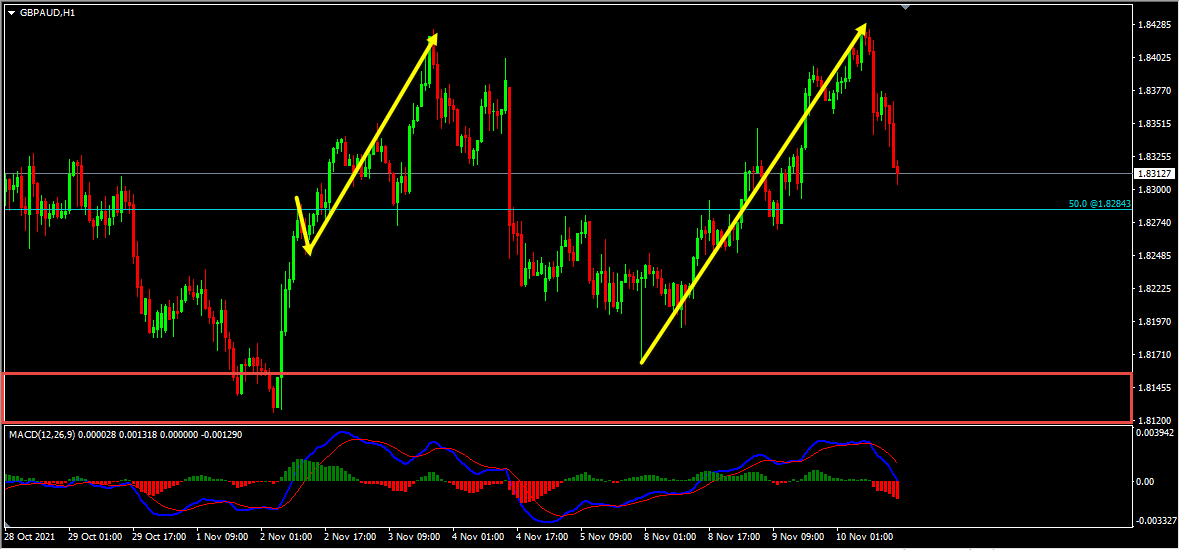
On the H1 chart, based on the above-mentioned analysis my short-term view was bullish here and I was expecting the price to move higher further. After the bullish convergence, the pullback that I was looking for happened, also there were no signs opposing this short term bullish view. The price then moved higher further as I expected it to and delivered 170+ move to the upside! The price then moved lower but it didn’t break below the strong support zone and was holding above it. We also had a bullish divergence that has formed between the first low that has formed at 1.82133 and the second low that has formed at 1.81639 based on the MACD indicator, which we may consider as evidence of bullish pressure. The price then moved higher again and has delivered 260+ pips move!
(Note: You can learn about a Killer Forex Strategy “Double Trend Line Principle” here)
For similar trade ideas and much more I invite you to
Also, you can get one of our strategies free of charge. You will find all the details here
If you have any further questions, don’t hesitate to drop a comment below!
Happy Trading!
Arvinth Akash
Traders Academy Club Team.
Hi Traders! Arvinth here from the Home Trader Club team. The weekly summary and, review of July…
The Japanese yen surged on Thursday, in a move analysts said bore the hallmarks of…
Hi Traders! EURAUD short term forecast and technical analysis is here. We do our analysis…
Hi Traders! NZDCAD short term forecast update and follow up is here. On June 2nd,…
Hi Traders! NZDCHF short term forecast and technical analysis is here. We do our analysis…
Hi Traders! AUDUSD short term forecast follow-up and update is here. On May 27th 2026…