Hi Traders! GBPCHF technical analysis and forecast is here. The way I would like to analyze the chart for setups is based on multi-timeframe confirmations because in my POV if we get more evidences on different timeframes for the same direction then it makes the setup much more reliable. If you would like to learn more about the way we trade and the technical analysis we use then check out the Traders Academy Club Spoiler alert – free memberships are available! This analysis will be based on price action trading (if you want to learn about price action trading, you can watch this video here).
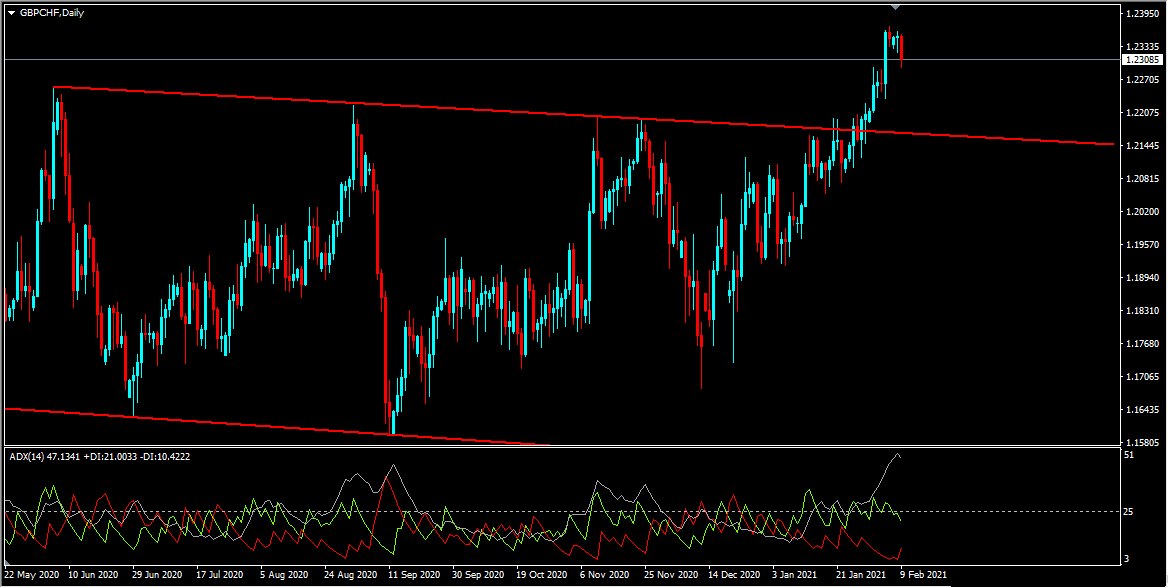
On the daily chart, the price was moving inside a range, this range is formed by the highs and lows reaching parallel resistance and support zones. The price which was respecting this range so far has broken above the top of this range and is holding above it. We may consider this as evidence of bullish pressure. In addition to this, the ADX indicator gave a bullish signal at the cross of +DI (green line) versus -DI (red line), and the main signal line (silver line) reads value over 25, we may consider these as another evidences of bullish pressure. Also, there are no evidences that show the bullish trend is over yet.
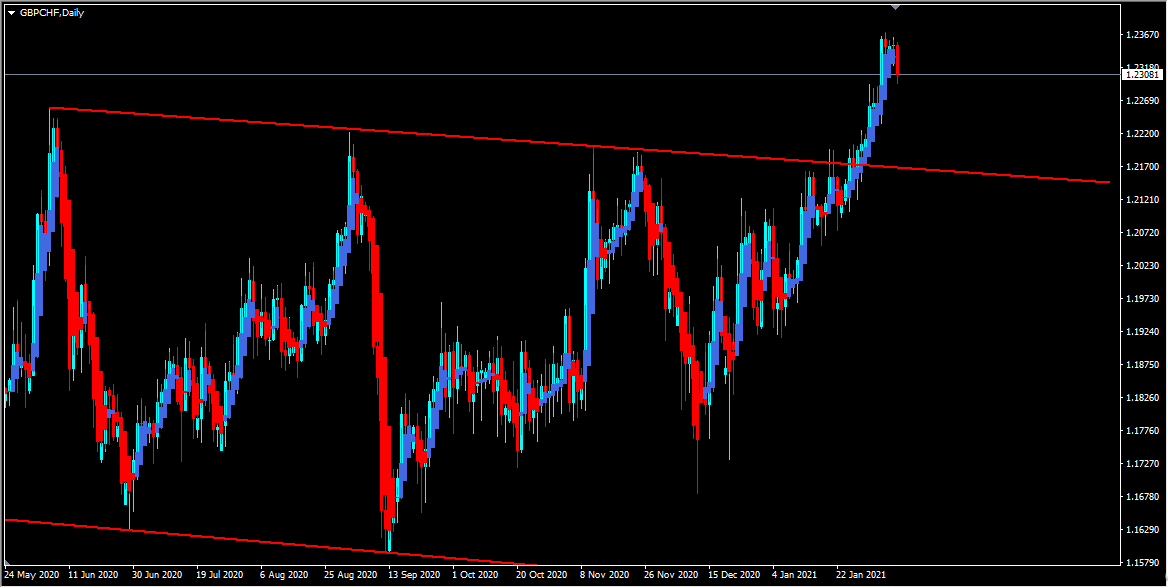
Also, based on the Heikin Ashi candles we can see that currently, we have strong bullish bodies in upward moving market conditions so it basically reflects a bullish environment. We may consider this as yet another evidence of bullish pressure. We may now move down to lower timeframe and see if we can find evidence supporting this bullish view.
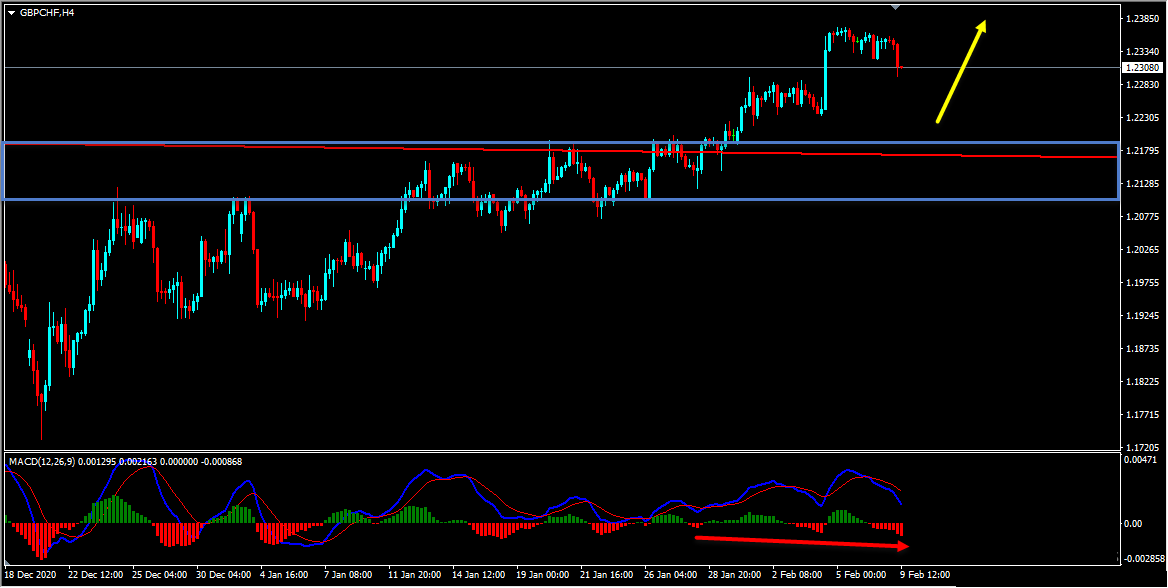
On the H4 chart, the price which is moving higher has created a series of higher highs, higher lows which basically reflects a bullish trend. Also in addition to this, we have a potential bullish hidden divergence that is forming between the first low that has formed on 28th January 2021 and the second current low that has formed on 9th February 2020 based on the MACD indicator. We also had a strong resistance zone that had formed which the price has broken above and currently, this strong resistance zone is acting as a strong support zone for us. So until this strong support zone holds my view remains bullish here and I expect the price to continue higher further.
GBPCHF D1(Daily) Chart Analysis
GBPCHF H4(4 hours) Chart Analysis
It is always recommended to look for confirmations before you jump into any trade. If you are not sure about how to trade this buy setup then you can use any setup and strategy that you have in your arsenal to look for bullish moves and join this buy trade.
Also don’t forget to protect your buy trade using a stop loss and make sure to set a target and keep a proper risk/reward ratio.
You will also find a pretty extensive database of educational materials here in the blog – just use the search or check out the Forex Education section above.
Not sure how to enter a trade? Spot reversals (bounces)? Not sure how to spot breakouts?
I invite you to join us in our live market analysis, on daily basis, and improve your trading with us.
Also, you can get one of our strategies free of charge. You will find all the details here
If you have any further questions, don’t hesitate to drop a comment below!
Happy Trading!
Yordan Kuzmanov
Chief Trader at the Traders Academy Club
Hi Traders! Arvinth here from the Home Trader Club team. The weekly summary and, review of April…
Hi Traders! Gold short term forecast update and follow up is here. On February 5th,…
Hi Traders! Dax short term forecast and technical analysis is here. We do our analysis…
Hi Traders! NZDUSD short term forecast and technical analysis is here. We do our analysis…
We are pleased to officially announce our new partnership with AvaTrade, one of the most…
Hi Traders! EURUSD short term forecast and technical analysis is here. We do our analysis…