Hi Traders! GBPNZD forecast update follow up is here. On March 18th I shared this “GBPNZD Technical Analysis And Forecast” post in my blog. In this post, let’s do a recap of this setup and see how it has developed now. If you would like to learn more about the way we trade and the technical analysis we use then check out the Traders Academy Club. Spoiler alert – free memberships are available!
My Idea:
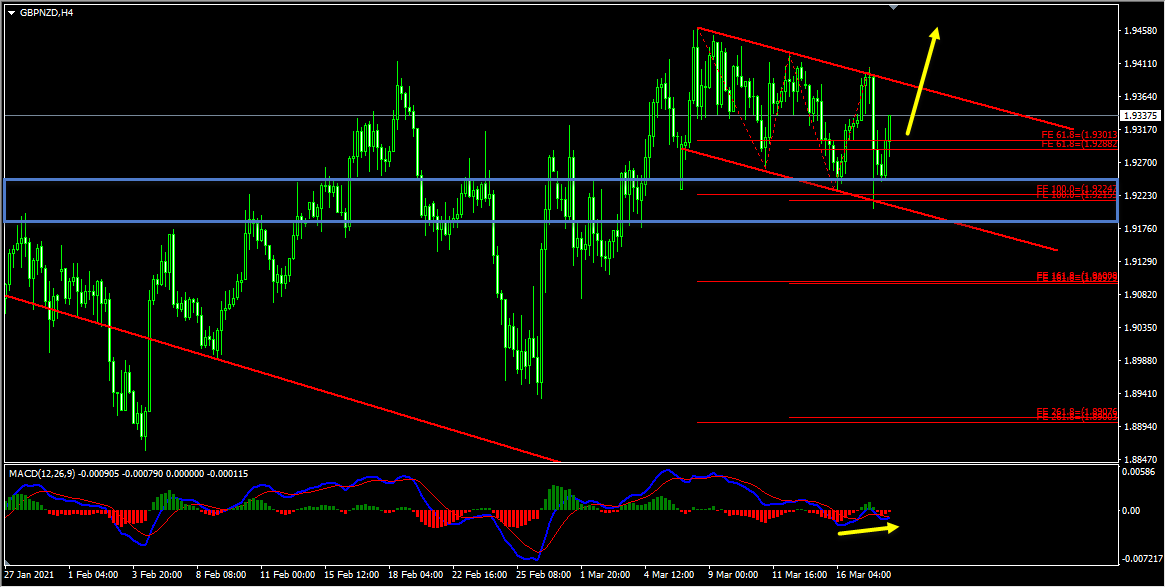
Looking at the H4 chart we could see that the daily correction is happening in the form of a range. This range is formed by the highs and lows reaching parallel support and resistance zones. The price which is moving inside this range has reached a key support zone formed by the 100%(1.92155) Fibonacci expansion level of the first wave, the 100%(1.92247) Fibonacci expansion level of the second wave, and the bottom of this range. The price respected this key support zone and bounced higher from this zone. We also had a bullish divergence that has formed between the first low that has formed at 1.92323 and the second low that has formed at 1.92051 based on the MACD indicator which we may consider as evidence of bullish pressure. So until this key support zone holds my view remains bullish here and if we get a valid breakout above the top of this range, we may then consider it as a validation for the bullish view and may expect the price to move higher further.
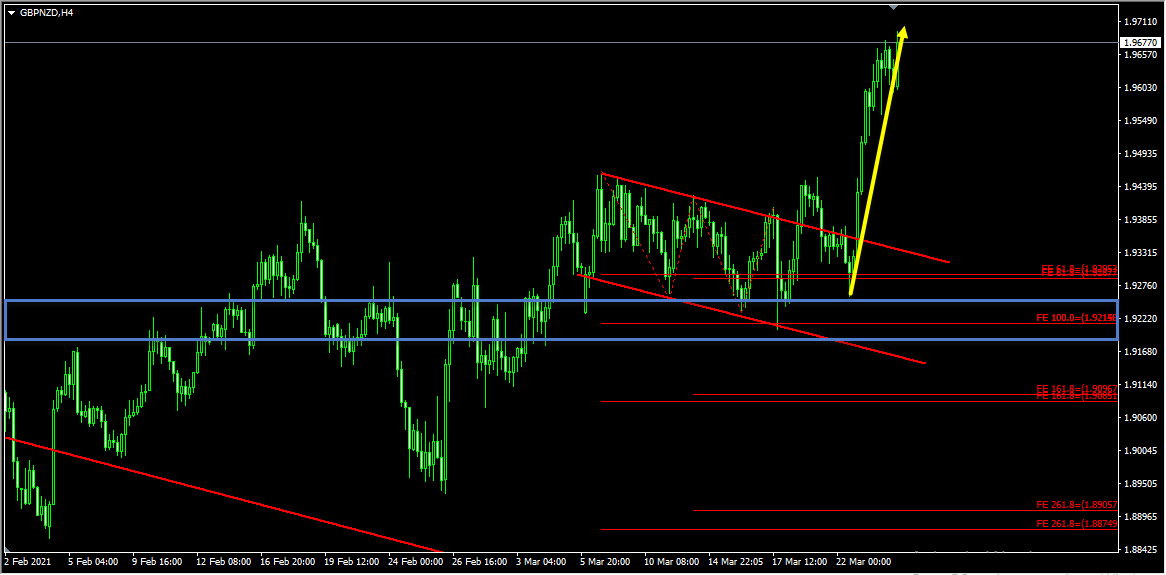
Based on the above-mentioned analysis my view was bullish here and I mentioned that “if we get a valid breakout above the top of this range, we may then consider it as a validation for the bullish view and may expect the price to move higher further”. The validation for the bullish view which is a valid breakout above the top of the range happened as I expected it to. Then we had a pullback with the price reaching the key support zone and respected it. The price then moved higher and delivered 430+ pips move so far.
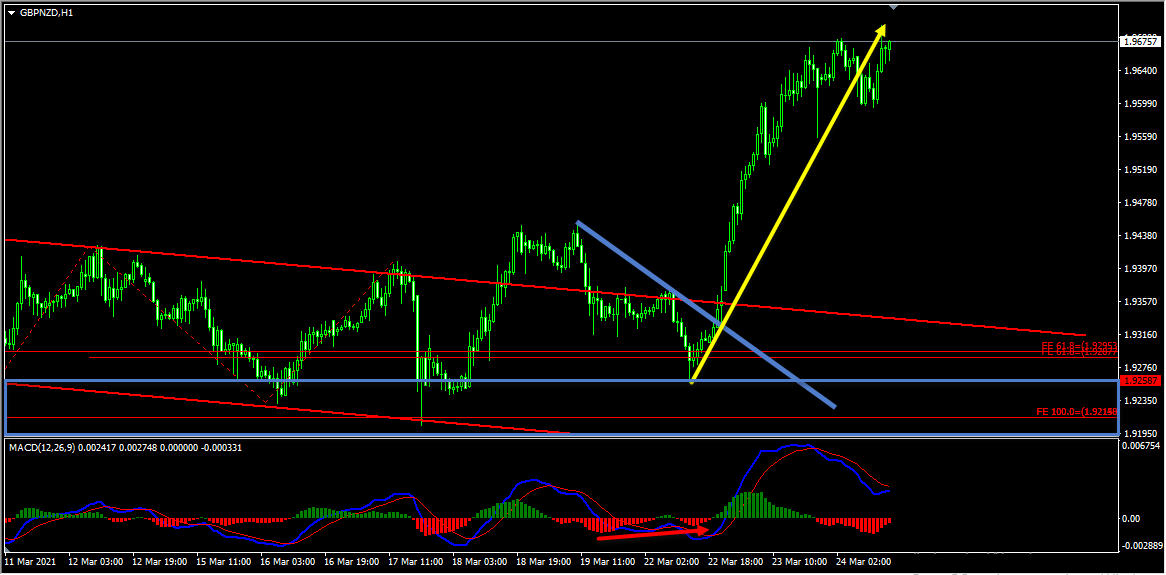
On the H1 chart, the market provided us with various facts supporting the bullish view. After the breakout at the top of the range, the H4 chart pullback happened in the form of double wave down on the H1 chart with the price creating a bullish divergence between the first low that has formed at 1.93170 and the second low that has formed at 1.92579 based on the histogram of the MACD indicator. The price then moved higher and broke above the most recent downtrend line, we may consider these as facts provided by the market supporting the bullish view. Then as you can see in the image below how the price moved higher after that and provided an extraordinary move to the upside!
(Note: You can learn about a Killer Forex Strategy “Double Trend Line Principle” here)
So traders when it comes to trading, there are various important factors that we need to pay attention to, just because we have a good setup doesn’t mean that we can enter the trade randomly and it will pay us huge profits. First of all, we need to validate the entry and we should have a perfect entry plan to get into the trade which is a key factor when it comes to trading. This GBPNZD forecast is yet another good example of this scenario.
For similar trade ideas and much more join the Traders Academy Club and get access to our complete watch list and trade report.
This is how the report looks like. A table with the hottest market opportunities, screenshot behind every pair and time frame (anything that is in blue inside the table is clickable and leads to a screenshot) + a summary in text format, kind of highlights. And of course, Live Market Analysis every single day.
If you have any further questions, don’t hesitate to drop a comment below!
To your success,
Vladimir Ribakov
Certified Financial Technician
Hi Traders! Arvinth here from the Home Trader Club team. The weekly summary and, review of July…
European markets edged lower on Thursday following more overnight volatility in Asia’s tech-dominated indexes, while…
Hi Traders! EURGBP short term forecast and technical analysis is here. We do our analysis…
Hi Traders! Bitcoin short term forecast update and follow up is here. On May 7th,…
Hi Traders! AUDJPY short term forecast and technical analysis is here. We do our analysis…
Hi Traders! Oil short term forecast and technical analysis is here. We do our analysis…