Hi Traders! GBPUSD forecast follow up and update is here. On March 3rd I shared this “GBPUSD Forecast And Technical Analysis” post in my blog. In this post, let’s do a recap of this setup and see how it has developed now. If you would like to learn more about the way we trade and the technical analysis we use then check out the Traders Academy Club. Spoiler alert – free memberships are available!
My Idea
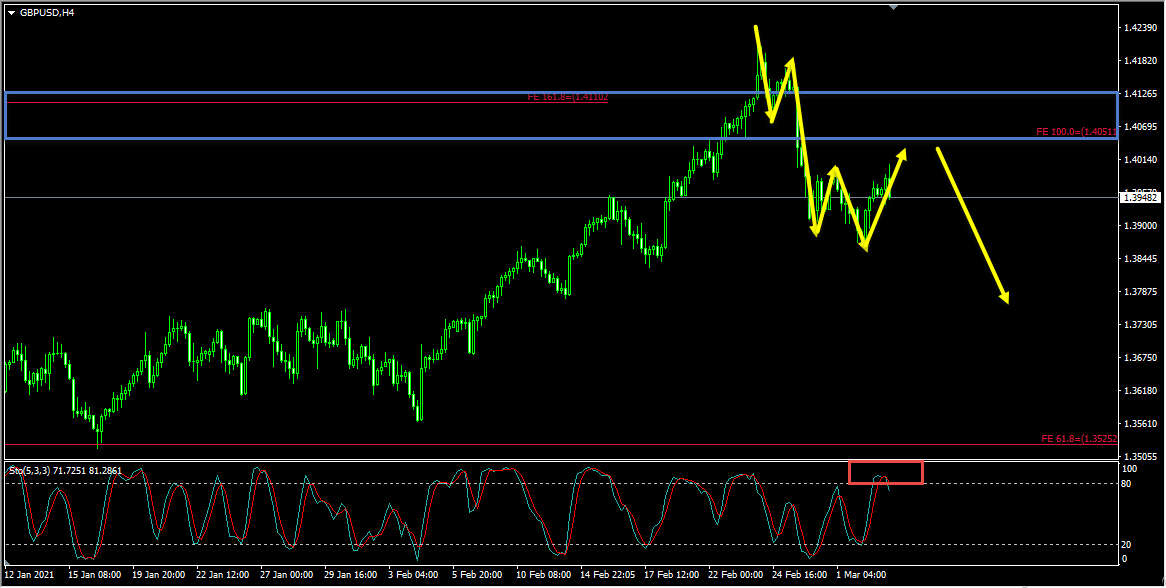
On the H4 chart, we could see that the price which is moving lower has created a bearish trend pattern in the form of three lower highs, lower lows we may consider this as evidence of bearish pressure. Generally, after a bearish trend pattern, we may expect corrections and then further continuation lower. Currently, it looks like a correction is happening. In addition to this based on the Stochastic Oscillator, we could see that the price has reached its extreme here as well, we may consider this as yet another evidence of bearish pressure. So everything looks good here for the bears and until this strong resistance zone (marked in blue) shown in the image below holds my view remains bearish here and I expect the price to continue lower further.
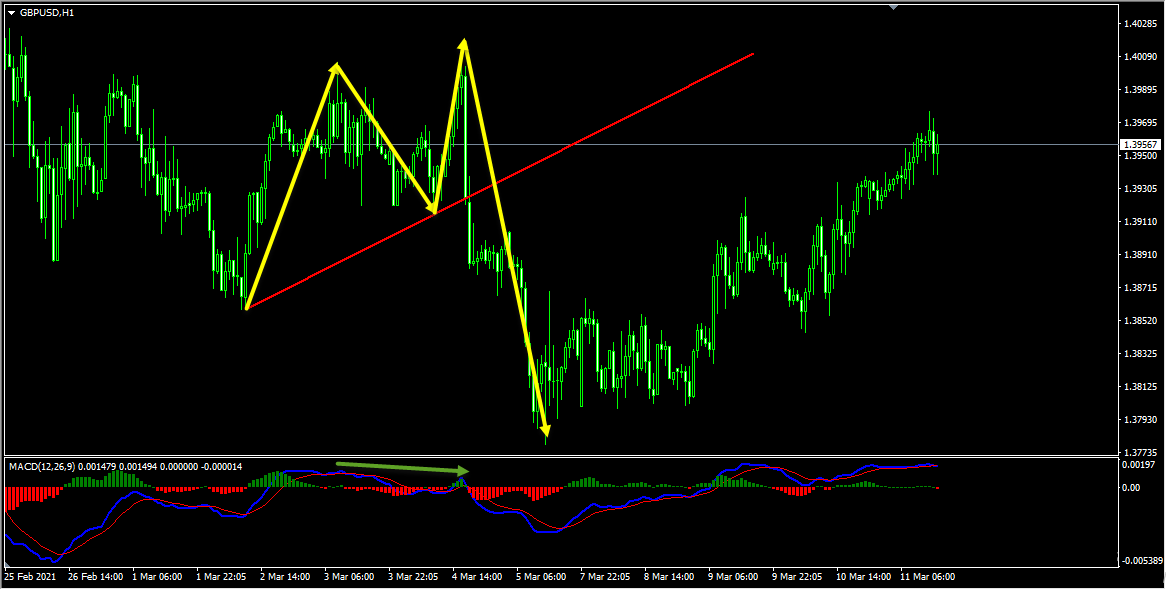
On the H4 chart, my view was bearish and I was expecting the price to move lower further until the strong resistance zone holds. After the bearish trend pattern, we had a pullback and the price was holding below the strong resistance zone. The price then moved lower further as I expected it to and delivered around 240 pips move until it was blocked by a bullish divergence.
(Note: You can learn about a Killer Forex Strategy “Double Trend Line Principle” here)
(Note: You can follow us here on Trading View and also on our blog to get similar ideas on a daily basis)
For similar trade ideas and much more join the Traders Academy Club and get access to our complete watch list and trade report.
This is how the report looks like. A table with the hottest market opportunities, screenshot behind every pair and time frame (anything that is in blue inside the table is clickable and leads to a screenshot) + a summary in text format, kind of highlights. And of course Live Market Analysis every single day.
If you have any further questions, don’t hesitate to drop a comment below!
Happy Trading!
Yordan Kuzmanov
Chief Trader at the Traders Academy Club
Hi Traders! Arvinth here from the Home Trader Club team. The weekly summary and, review of July…
European markets edged lower on Thursday following more overnight volatility in Asia’s tech-dominated indexes, while…
Hi Traders! EURGBP short term forecast and technical analysis is here. We do our analysis…
Hi Traders! Bitcoin short term forecast update and follow up is here. On May 7th,…
Hi Traders! AUDJPY short term forecast and technical analysis is here. We do our analysis…
Hi Traders! Oil short term forecast and technical analysis is here. We do our analysis…