Hi Traders! Weekly Summary And Review March 12th, 2021 is here. It is now time to recap and summarize the trade setups that we had during this week. Below you will find the short explanation of all the trade setups we had in this week and how it has currently developed now.
First, we will see the trade ideas that I shared in my blog:
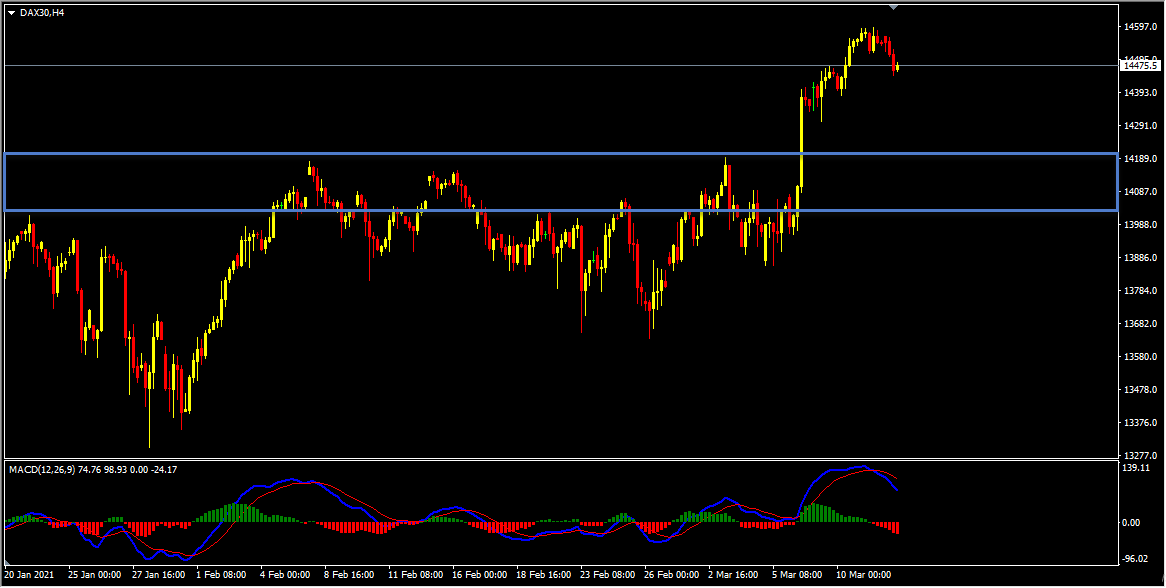
Dax – My idea here was “On the H4 chart the price which is moving higher has broken above the last high at 14192.5 and is holding above it, thus creating higher highs. We can also see that the price has created this higher highs based on the MACD indicator as well, we may consider this as evidence of bullish pressure. Also based on the Heikin Ashi candles we can see that currently, we have strong bullish bodies in upward moving market conditions so it basically reflects a bullish environment here as well. We may consider this as another evidence of bullish pressure. In addition to this based on the Parabolic Sar we could see that the dots are below the price here as well which we may consider as yet another evidence of bullish pressure. We also had a strong resistance zone that had formed which the price has broken above and currently, this strong resistance zone is acting as a strong support zone for us. So until this strong support zone holds my view remains bullish here and I expect the price to continue higher further after pullbacks”.
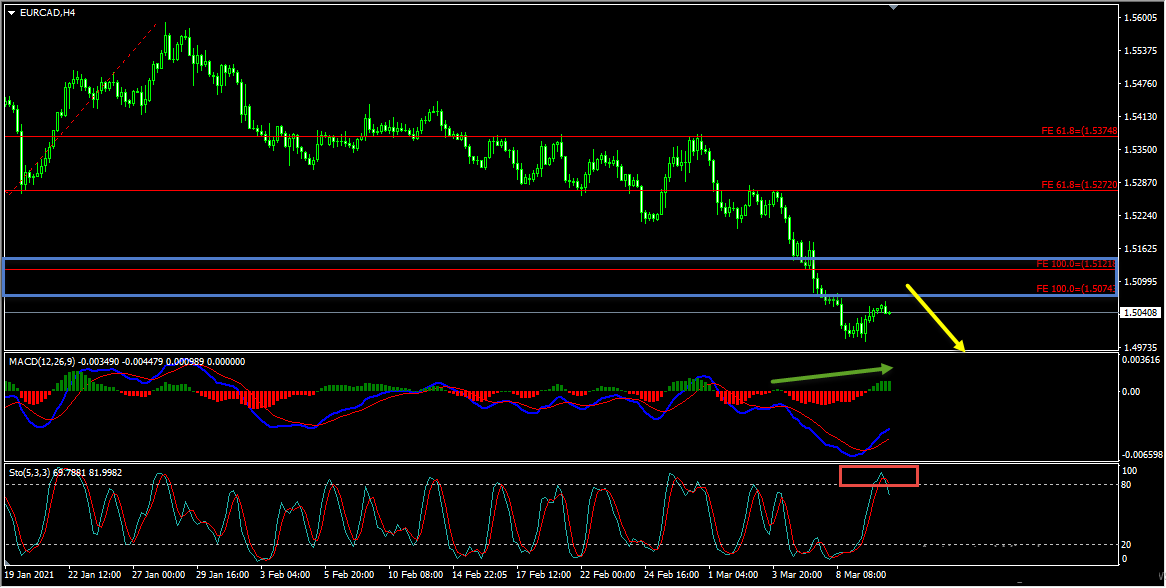
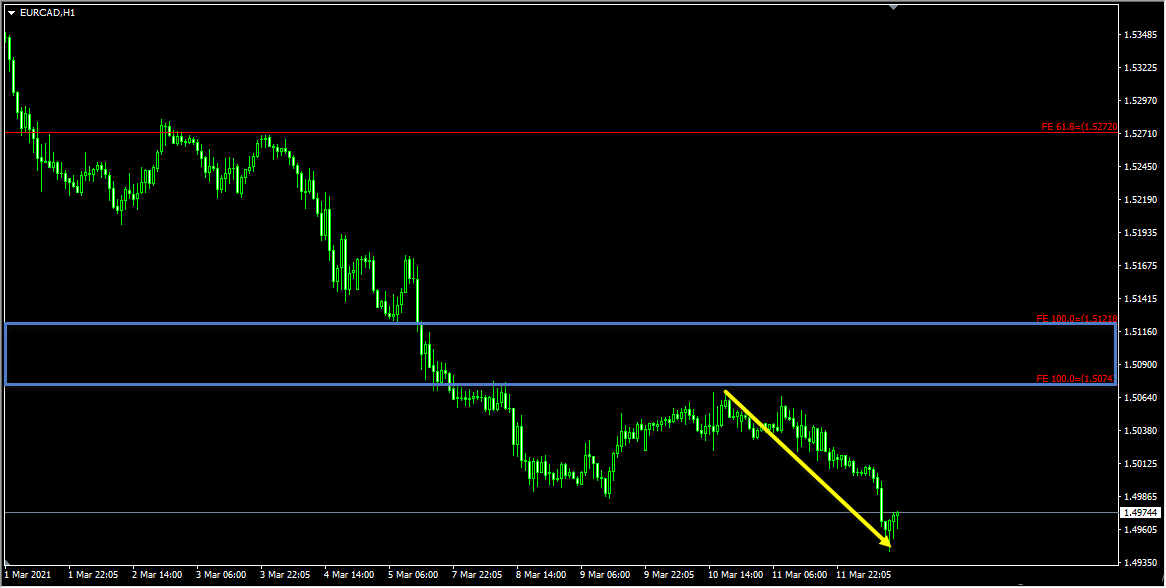
EURCAD – My idea here was “On the H4 chart currently, it looks like a correction is happening. We also have a bearish hidden divergence that has formed between the first high that has formed at 1.52695 and the second high that has formed at 1.50604 based on the histogram of the MACD indicator which we may consider as evidence of bearish pressure. In addition to this, we could see that the Stochastic Oscillator has reached it’s extreme, which we may consider as another evidence of bearish pressure. Until the strong resistance zone (marked in blue) shown in the image below holds my view remains bearish here and I expect the price to move lower further”.
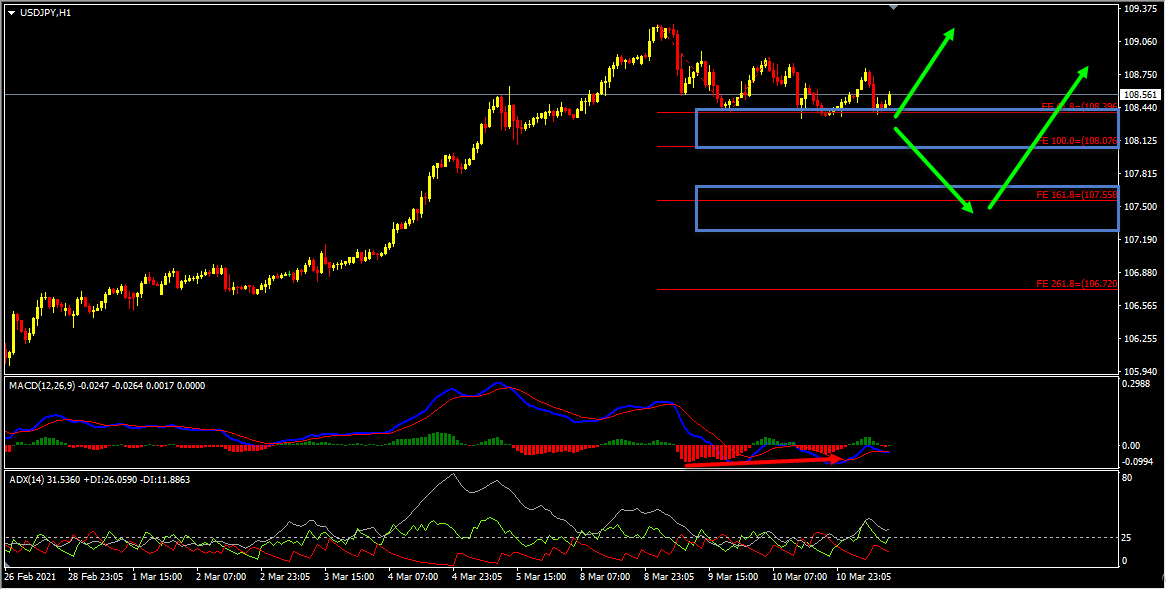
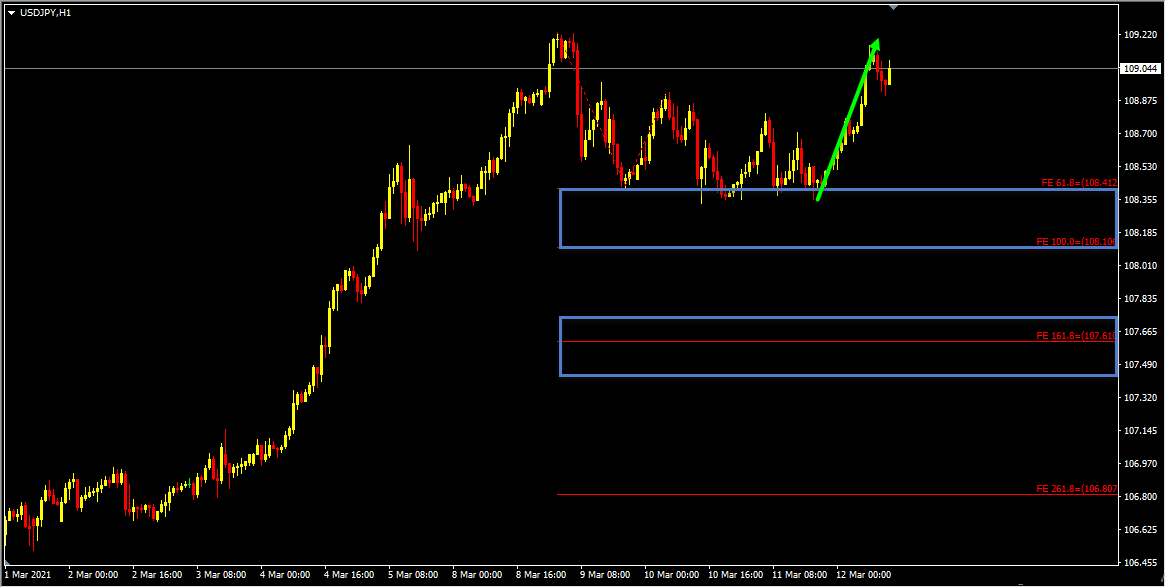
USDJPY – My idea here was as follows “Looking at the H1 chart we could see that the price which is moving lower has created a bullish divergence between the first low that has formed at 108.556 and the second low that has formed at 108.334 based on the MACD indicator, which we may consider as evidence of bullish pressure. Also, the ADX indicator gave a bullish signal here as well at the cross of +DI (green line) versus -DI (red line), and the main signal line (silver line) reads value over 25, we may consider this as yet another evidences of bullish pressure. In addition to this, we have two key support zones that have formed, the first key support zone is formed based on the 61.8%(108.396) and 100%(108.076) Fibonacci expansion level of the first wave. The second key support zone is formed by the 161.8%(107.558) Fibonacci expansion level of the first wave. Until both these key support zones hold my view remains bullish here and I expect the price to continue higher further”.
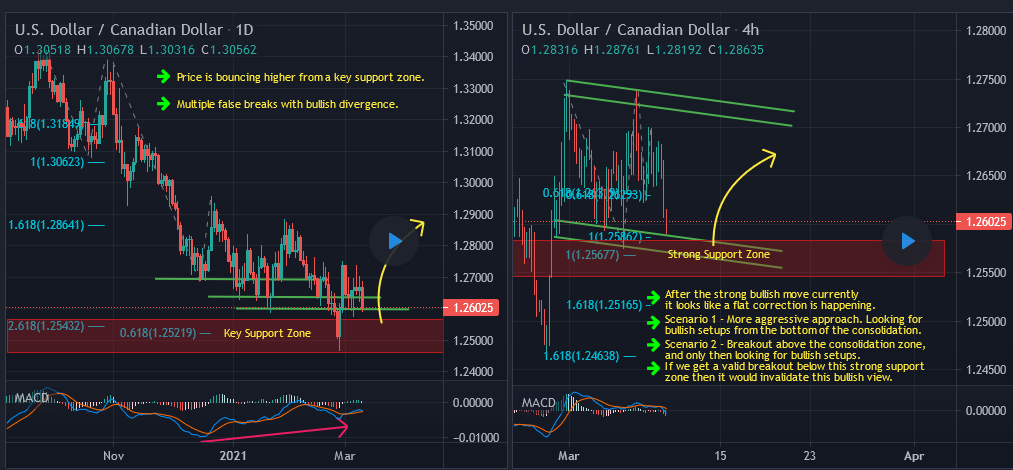
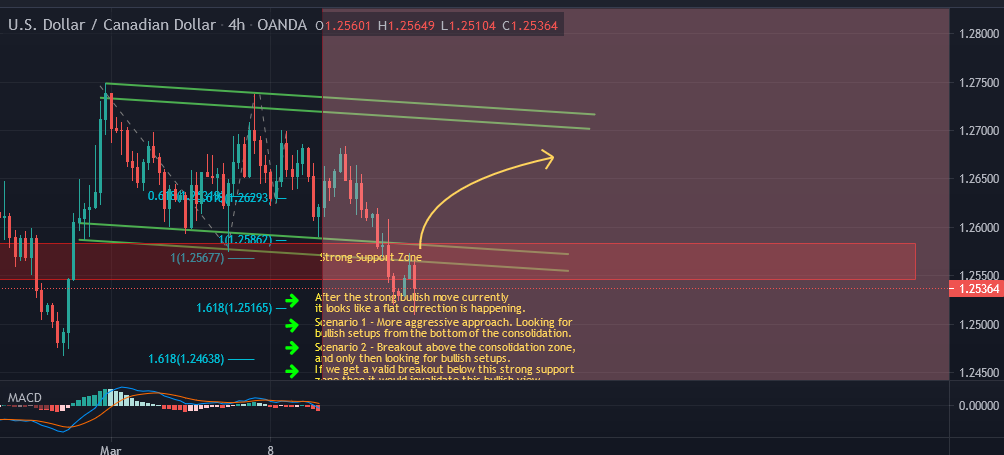
USDCAD – My idea here was as follows:
Current Scenario – On the H4 chart, based on the aggressive approach the price reached the key support zone and then provided a short push to the upside delivering 80+ pips move. The price then moved lower and broke below the key support zone and is currently holding below it. My current view on this pair is neutral.
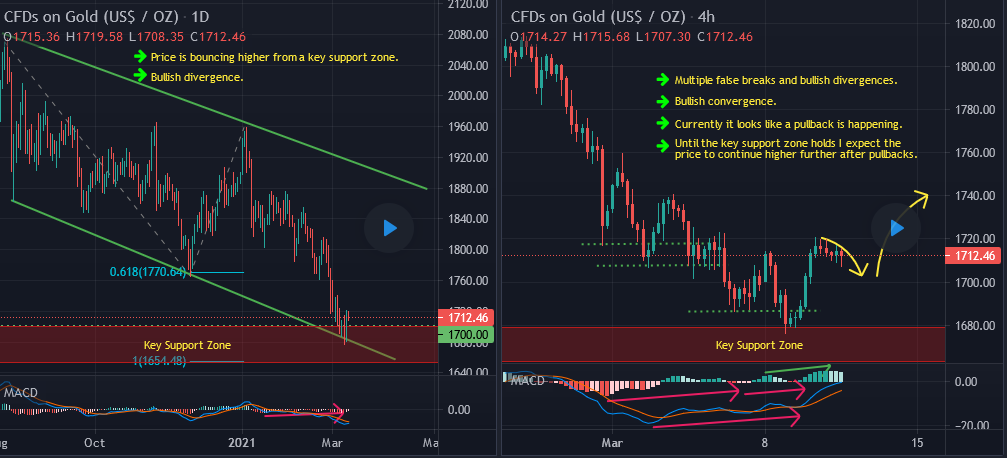
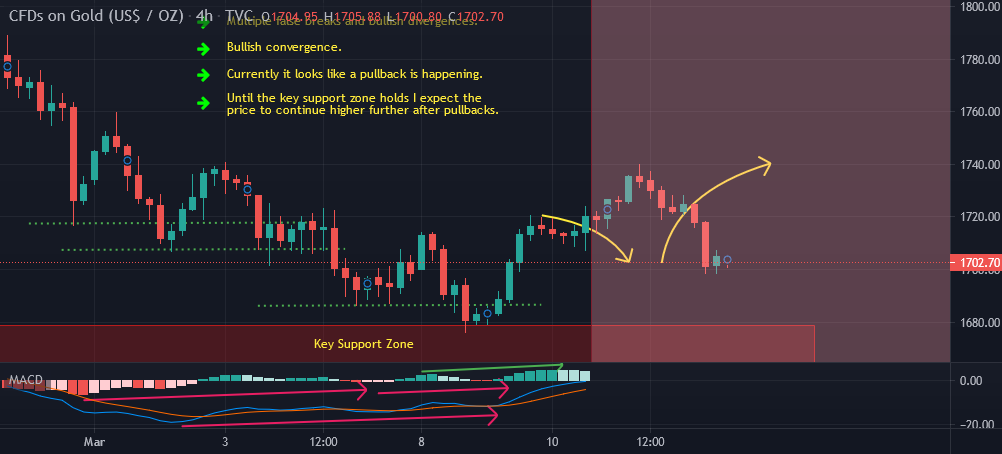
Gold – My idea here was as follows:
Current Scenario – Based on the above-mentioned analysis my view was bullish here and I was expecting the price to move higher further after pullbacks. The price action is following my analysis so far and currently it looks like the pullback that I was looking for is happening. My plan still remains the same here.
Note: You can follow me here on Trading View and also on my blog to get similar ideas on daily basis)
For similar trade ideas and much more join the Traders Academy Club and get access to our complete watch list and trade report.
This is how the report looks like. A table with the hottest market opportunities, screenshot behind every pair and time frame (anything that is in blue inside the table is clickable and leads to a screenshot) + a summary in text format, kind of highlights. And of course Live Market Analysis every single day.
If you have any further questions, don’t hesitate to drop a comment below!
To your success,
Vladimir Ribakov
Certified Financial Technician
Hi Traders! Arvinth here from the Home Trader Club team. The weekly summary and, review of July…
European markets edged lower on Thursday following more overnight volatility in Asia’s tech-dominated indexes, while…
Hi Traders! EURGBP short term forecast and technical analysis is here. We do our analysis…
Hi Traders! Bitcoin short term forecast update and follow up is here. On May 7th,…
Hi Traders! AUDJPY short term forecast and technical analysis is here. We do our analysis…
Hi Traders! Oil short term forecast and technical analysis is here. We do our analysis…