Hi friends,
Today I would like to share with you some interesting pattern on chart.
I am talking about GBPUSD, 4H chart timeframe.
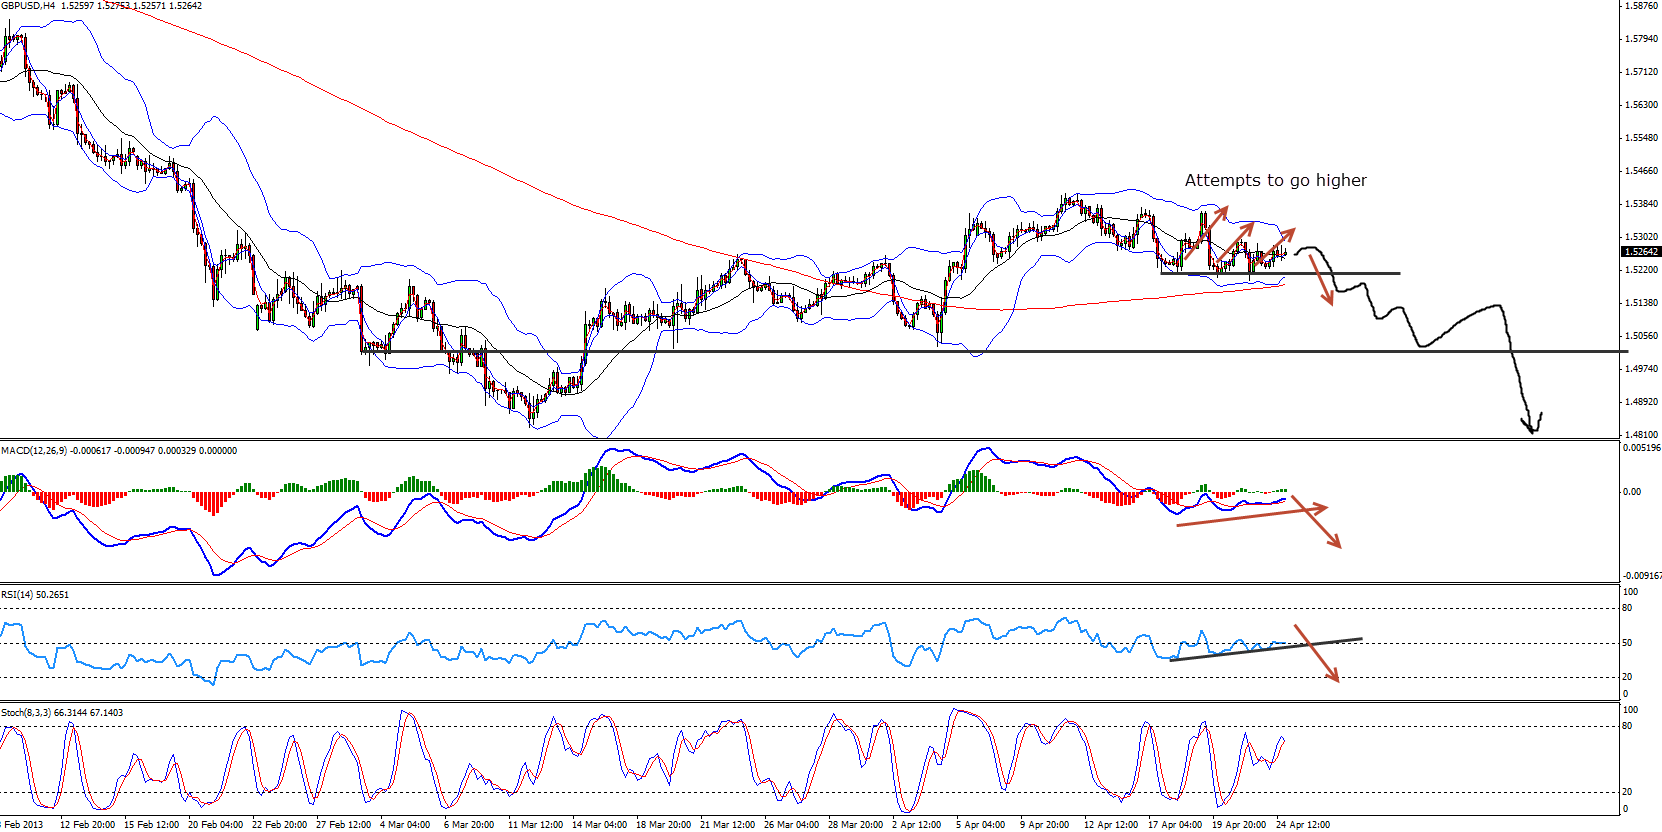
From what I see, there were several attempts to push higher after the bullish divergence but the prices never made a real rally. Such divergence. tend to be broken, and I think if the divergence. line will be broken here, we might see a bearish wave down to 1.50 and then 1.48. This wave might last something like two weeks. The fact that the weekly chart still holds the bearish convergence, as I’ve explained on my last weekly review, just supports the expected bearish wave.
Here is my chart, click to enlarge:
Of course my bearish scenario might be ignored if the news published tomorrow will surprise with positive numbers.
Any comment or idea?
Feel free to share.
Yours,
Vladimir Ribakov
http://www.vladimirforexsignals.com/
GDP growth is one of the most important indicators of economic health. But does stronger…
When it comes to fundamental Forex analysis, few institutions matter as much as the Federal…
Interest rates are one of the most important fundamental forces in the Forex market. But…
The latest U.S. employment report has delivered a significant warning for the market. With only…
The Forex market does not always offer clear trading opportunities. Sometimes, price moves sharply in…
Open social media for a few minutes and you can easily find someone talking about…
View Comments
Hi Atilla
Yes there is. You can, sure. Contact me by email directly, I have an offer to you. Vladimir.ribakov@gmail.com
EXACTLY!
I will explain all in weekly review :)
Thank you very much Marcello
Exactly
Like I showed on the charts
Thank you Theresa :)
It didn't fill the break, so there was no trade
Thank you very much Andrew
Hi Dr.Ketan
Yes of course if has to break the support, that's what I showed on the charts :)
It never happened though.
Regards the USDJPY I am more than agree :)