The markets are showing some fascinating technical developments this week, and there are several opportunities I believe traders should keep on their radar.
Could EUR/USD be approaching the end of its bearish move before recovering toward 1.14–1.15? Is GBP/JPY preparing for a deeper correction after forming a major bearish divergence? Could gold extend its decline toward 3,500 or even 3,000? And why am I still bearish on the S&P 500 despite the recent market movements?
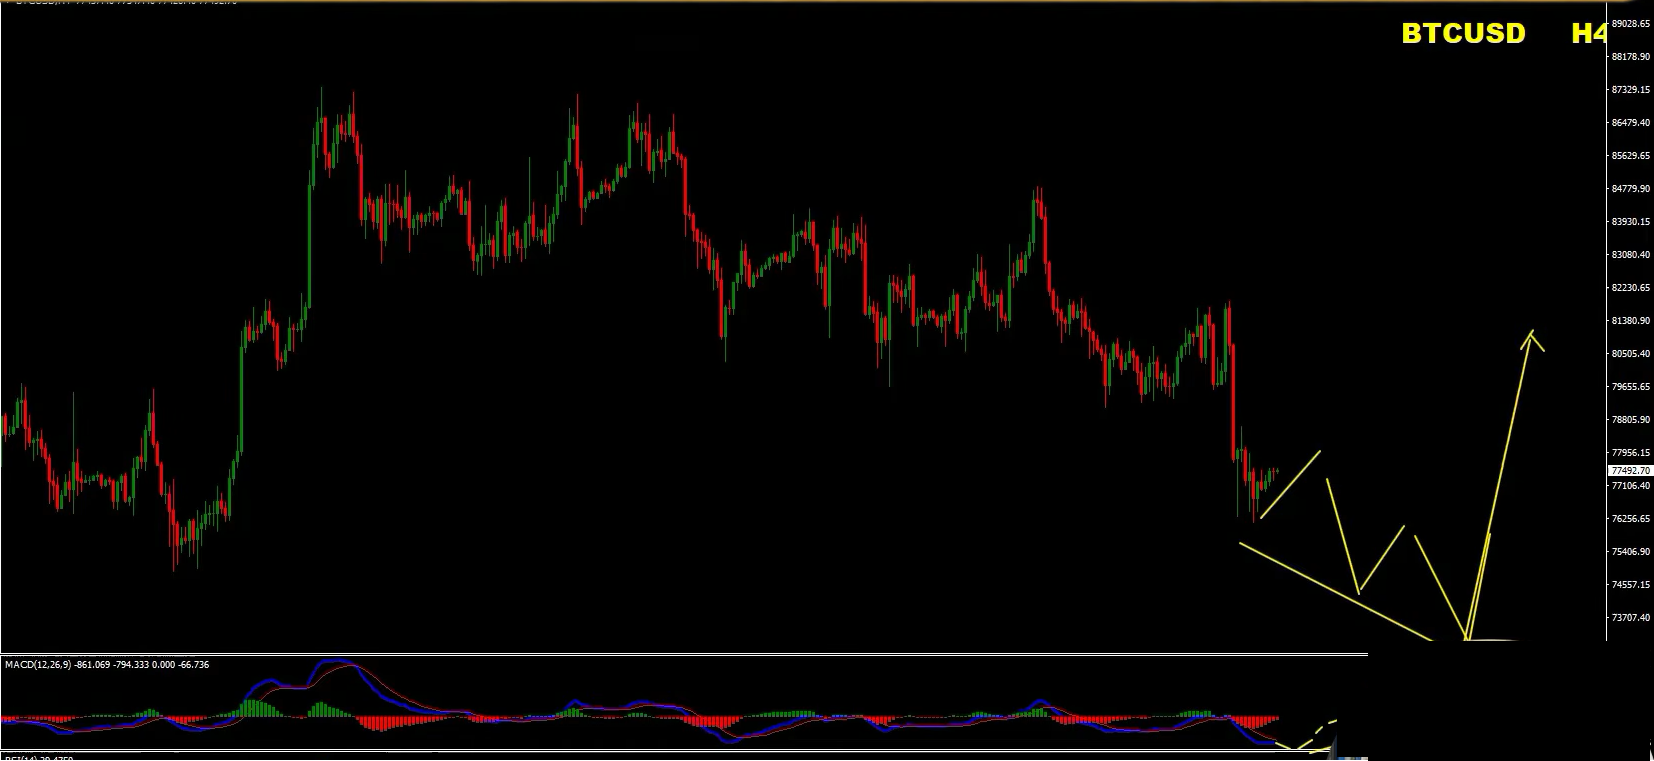
Bitcoin is also approaching an interesting technical area where a liquidity sweep could create a potential buying opportunity.
In this week’s Forex forecast, I will break down five major markets, explain the technical structures I am watching, and share the trading scenarios I believe could provide interesting opportunities.
We have partnered with AvaTrade, one of the industry’s leading regulated brokers.
When you open and trade with AvaTrade through our partnership, you receive:
If you’re looking to accelerate your trading journey while enjoying premium education, this partnership gives you everything you need under one roof.
If you already have account with them, still follow this link to open separate account with separate email. Once you did that, contact me with the telegram link below and we will give you the access.
Let’s take a look at the charts!
Trading Bias: Short-Term Bearish, Preparing for a Potential Bullish Reversal
Let’s start with the EUR/USD.
Following the latest central bank decisions, the euro received some support during the week. Although the European Central Bank did not raise interest rates, the overall communication remained relatively hawkish, helping the euro recover.
However, the bigger question is whether this recovery has enough strength to continue or whether we should expect another downward move first.
Remember our previous weekly forecast, where we discussed the possibility of two corrective upward waves before sellers regained control.
That scenario largely developed as anticipated, with EUR/USD eventually pushing lower.
Now, I believe we are approaching a potentially important turning point.
Although the shorter-term structure remains bearish, several technical factors suggest that the current bearish move could be approaching exhaustion.
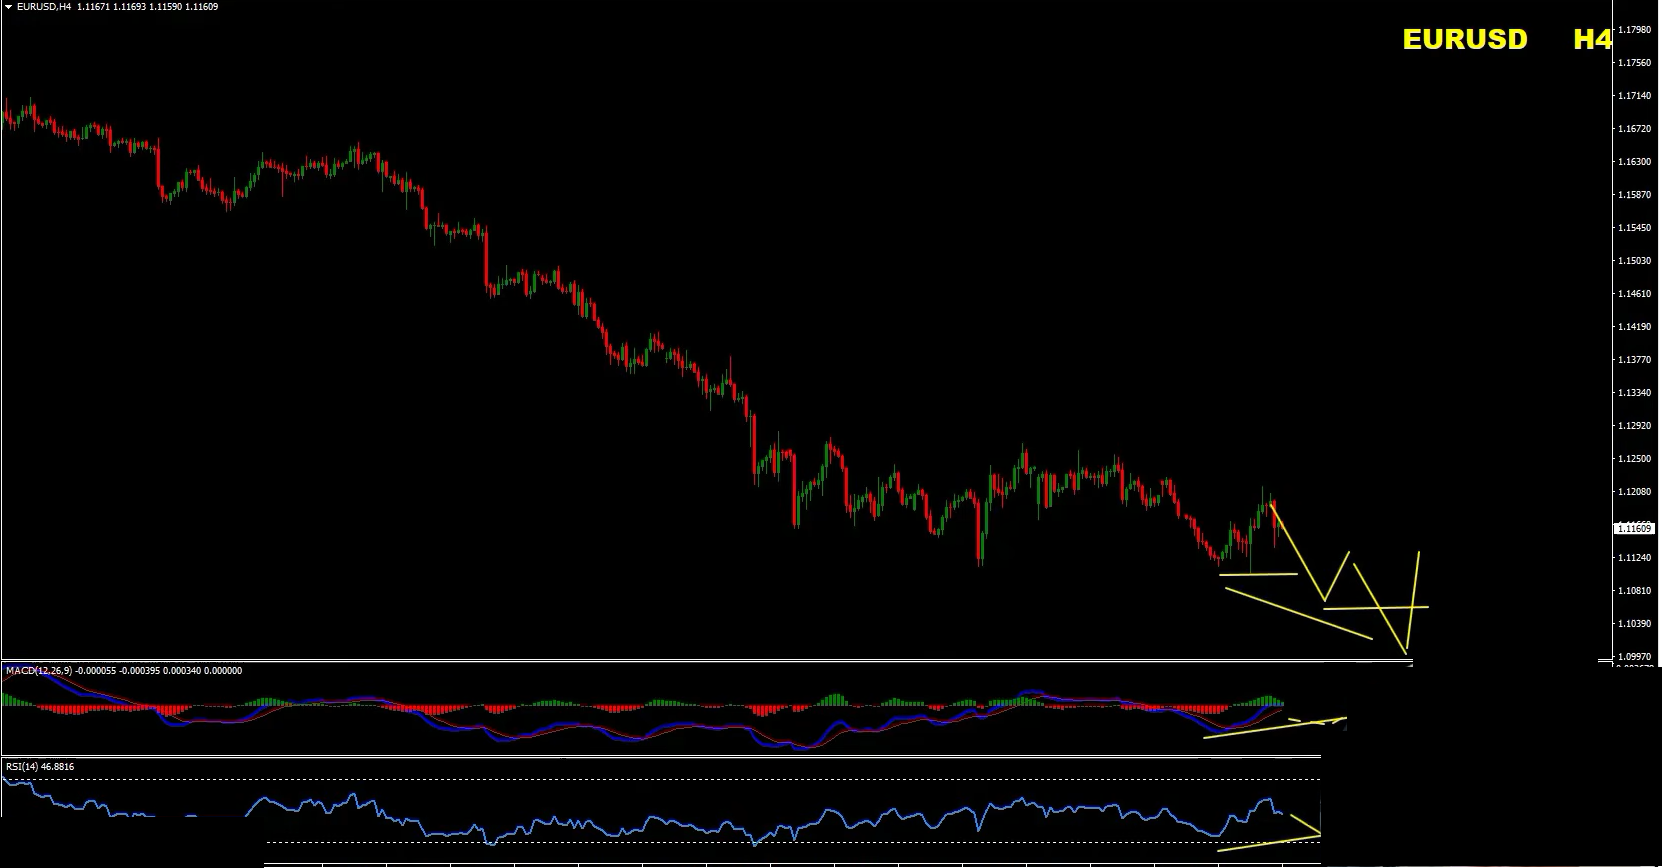
First, I am watching a liquidity area around the recent lows.
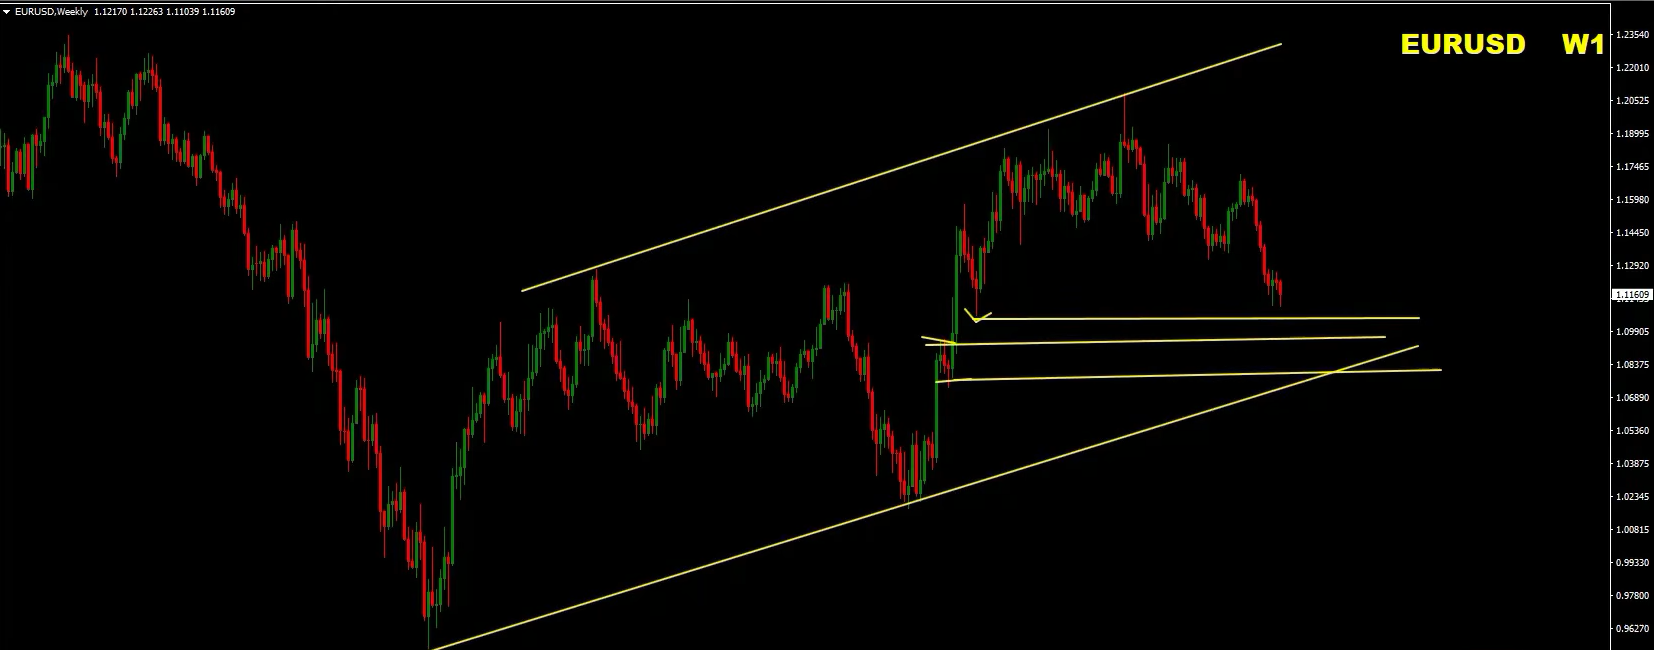
There is also an important consolidation zone acting as a potential demand area near the lower boundary of the rising structure.
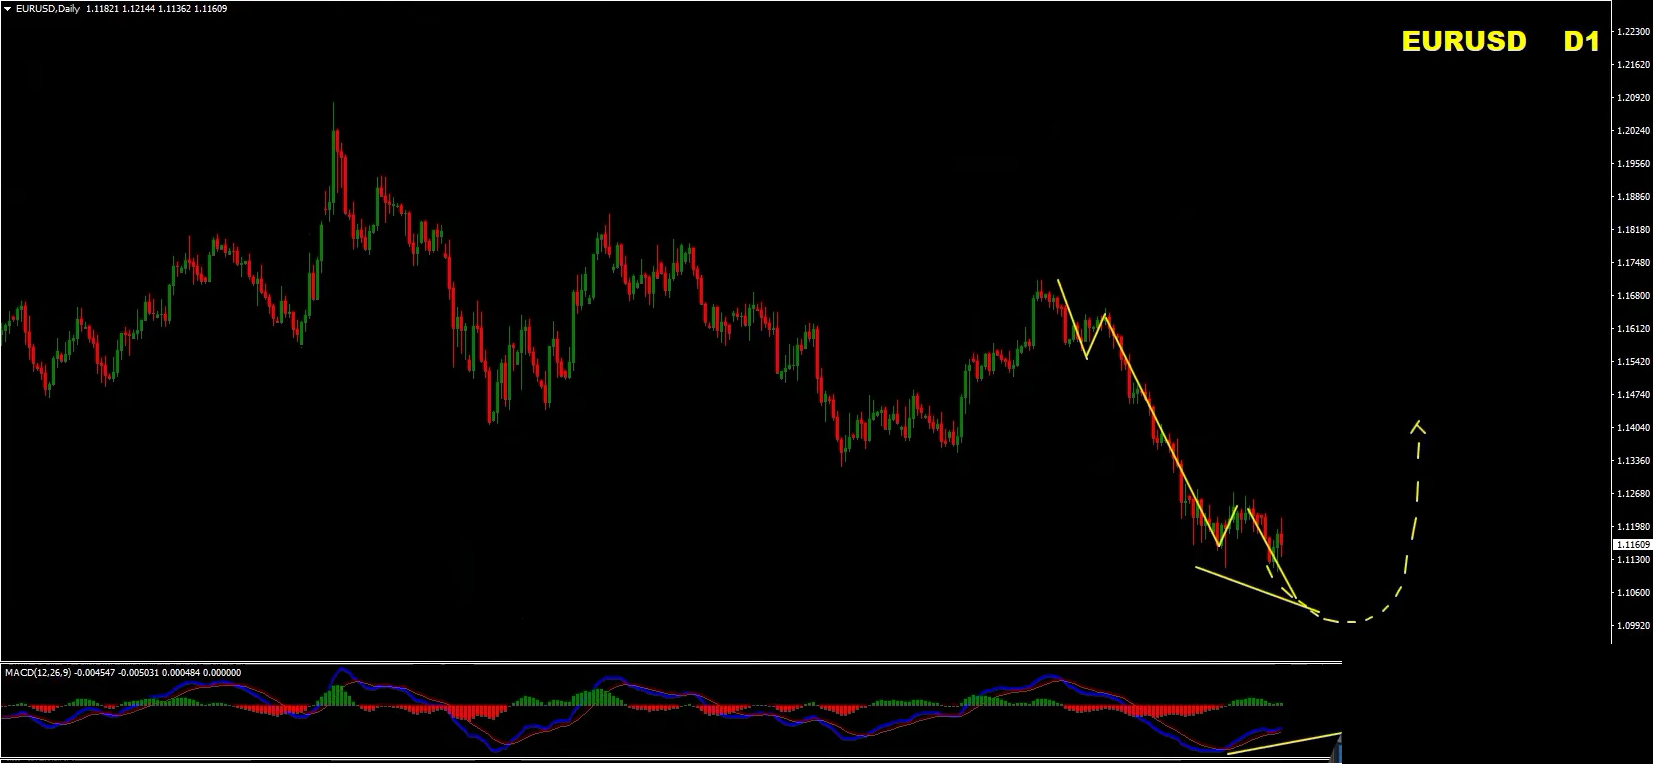
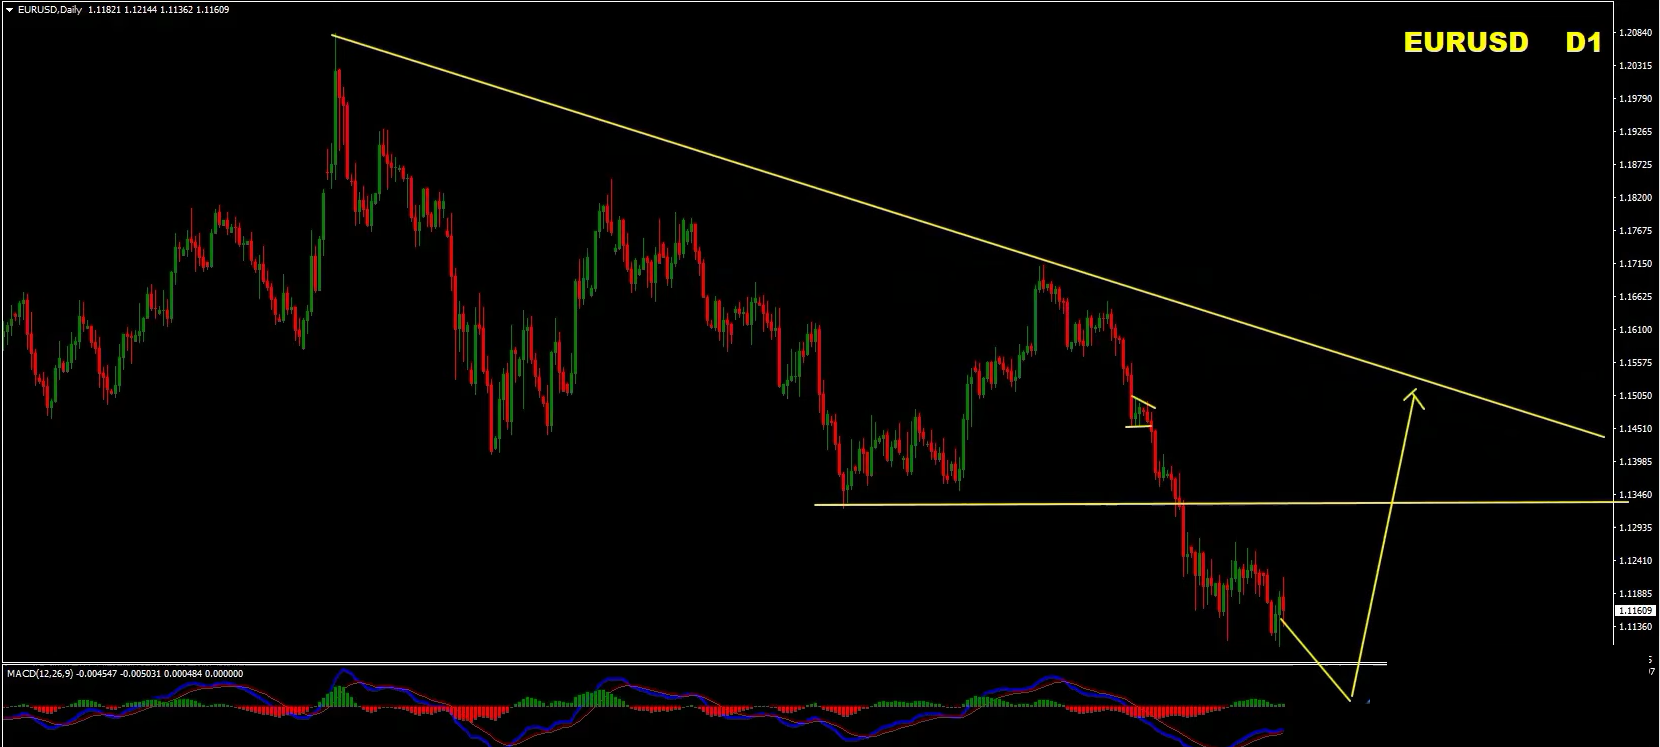
More importantly, the daily chart is beginning to show something interesting.
After several bearish waves, we are starting to see the possibility of bullish divergence developing.
Bullish divergence occurs when:
This type of structure can be an early indication that a bearish move is losing momentum and that buyers could eventually regain control.
However, divergence alone is not enough to confirm a reversal. I want to see price action provide additional confirmation.
Scenario 1: Liquidity Sweep Followed by Bullish Divergence
This is my preferred scenario.
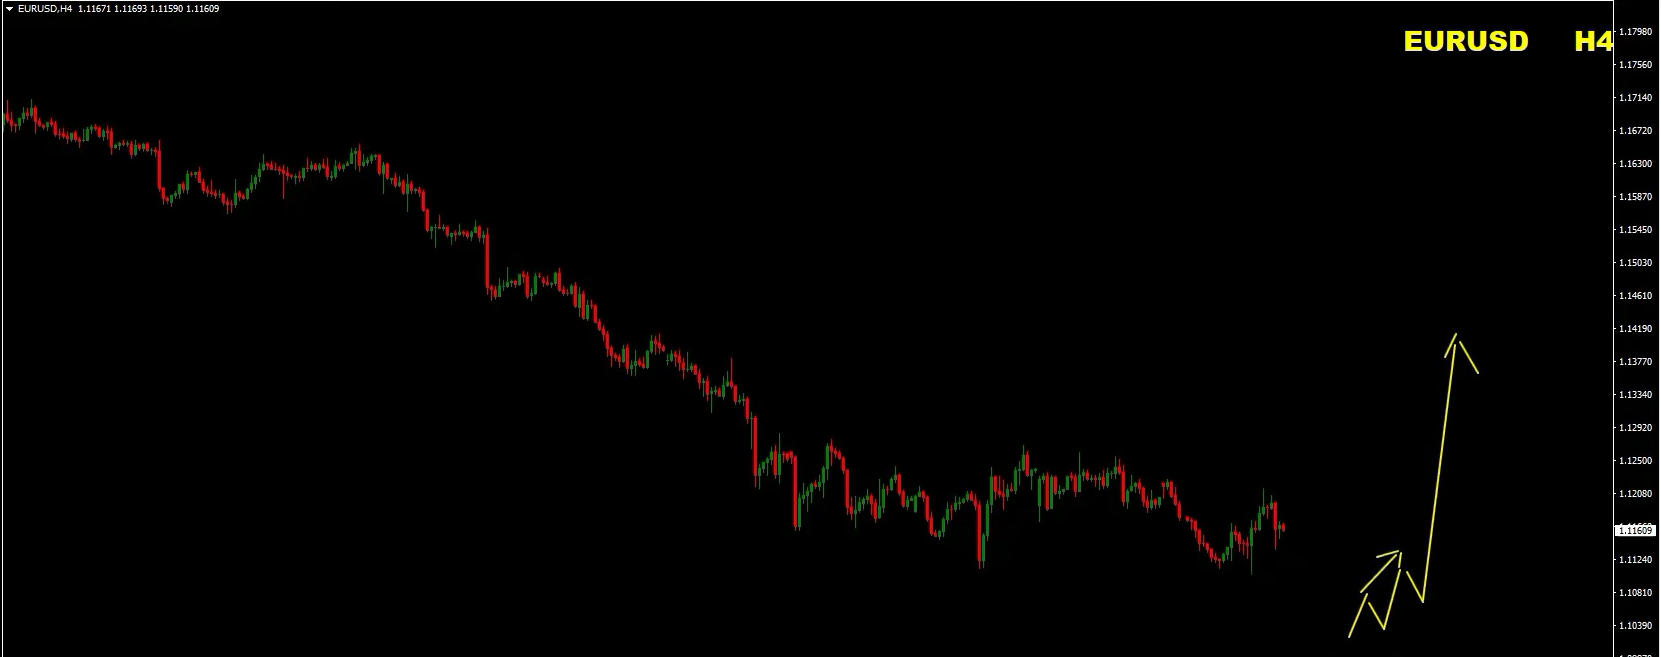
I would like to see EUR/USD make another move toward the downside, potentially creating false breakouts or liquidity sweeps around the recent lows.
If price creates lower lows while MACD or RSI forms higher lows, we could have a bullish divergence.
The next confirmation would be a bullish structural reversal, particularly a break toward higher highs.
Once this happens, I would start looking for buying opportunities.
Scenario 2: Immediate Bullish Recovery
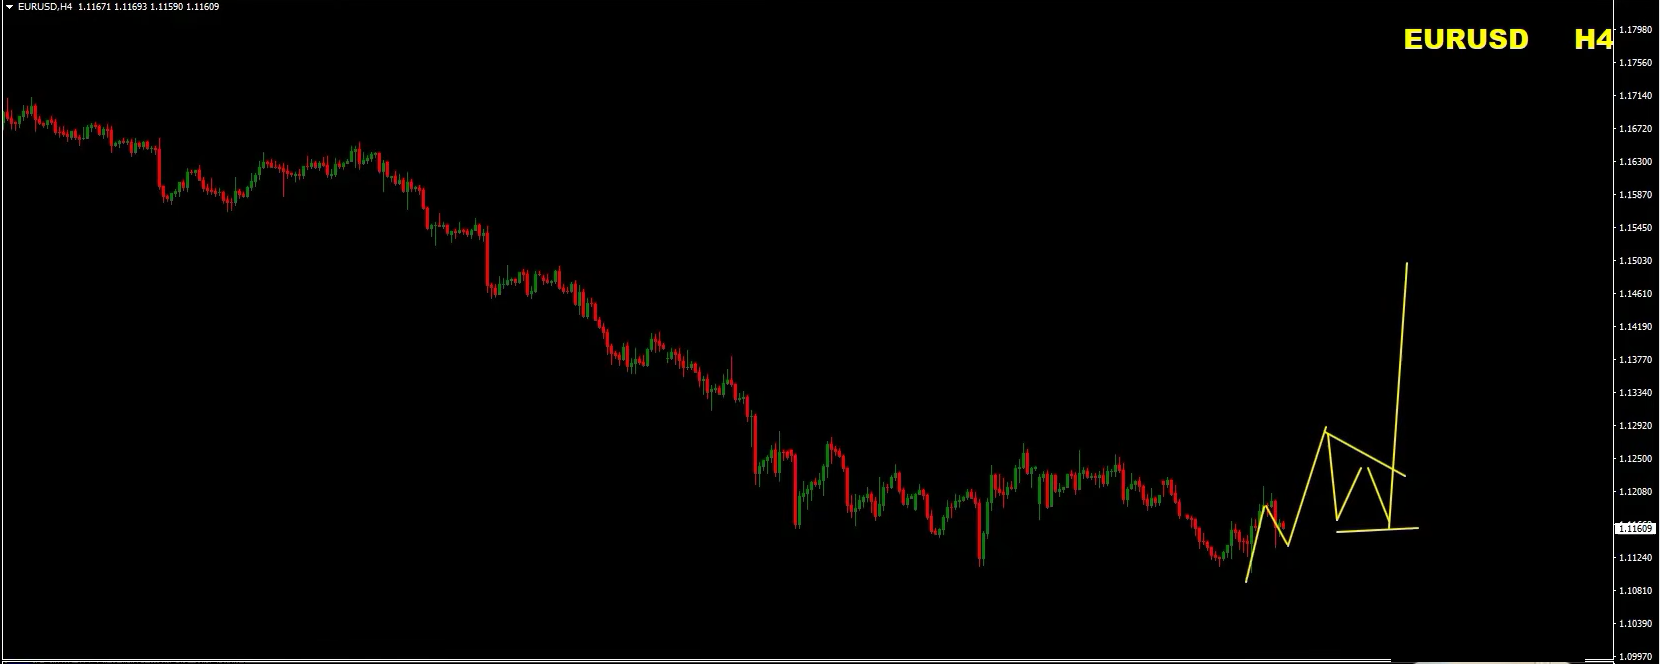
Another possibility is that EUR/USD begins forming higher highs without making another significant move toward the downside.
In that case, I would monitor the corrective movements and wait for price to break above the relevant resistance structure.
A confirmed breakout could provide another opportunity to join the bullish move.
If the reversal develops as expected, the first important area I am watching is around 1.13, particularly the previously broken support that could now act as resistance.
Beyond that, my main upside objective is the 1.14–1.15 region.
This area also corresponds with a major falling resistance line, making it an important zone to monitor.
My EUR/USD view: The bearish move could be approaching its final stages. I am watching for a liquidity sweep, bullish divergence, and structural confirmation before looking for buys.
The message is simple: the bottom could be approaching, so get ready for potential rallies.
Trading Bias: Bearish – Sell the Rallies
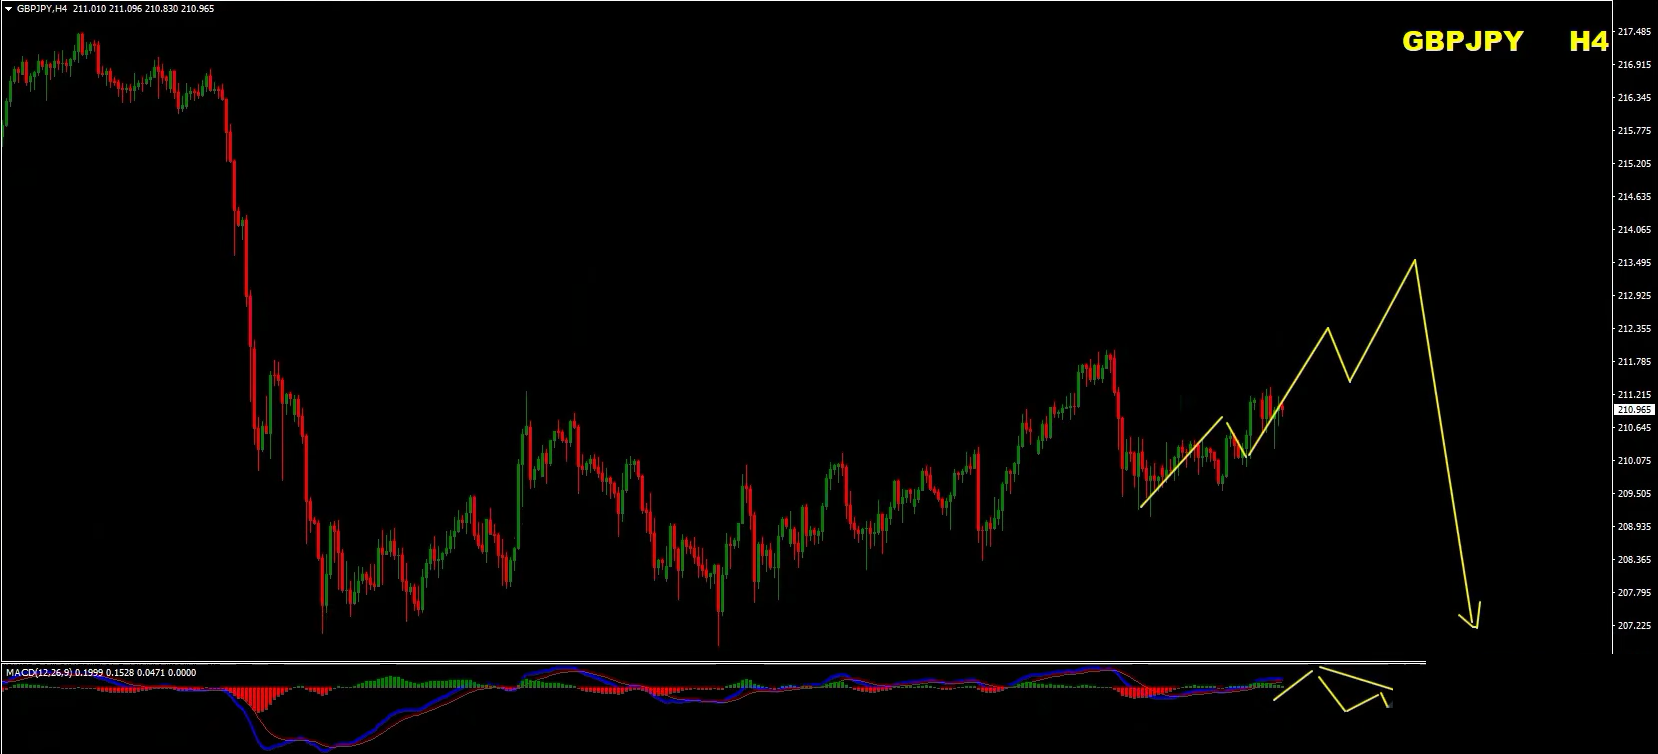
GBP/JPY is one of the most interesting bearish opportunities I am watching this week.
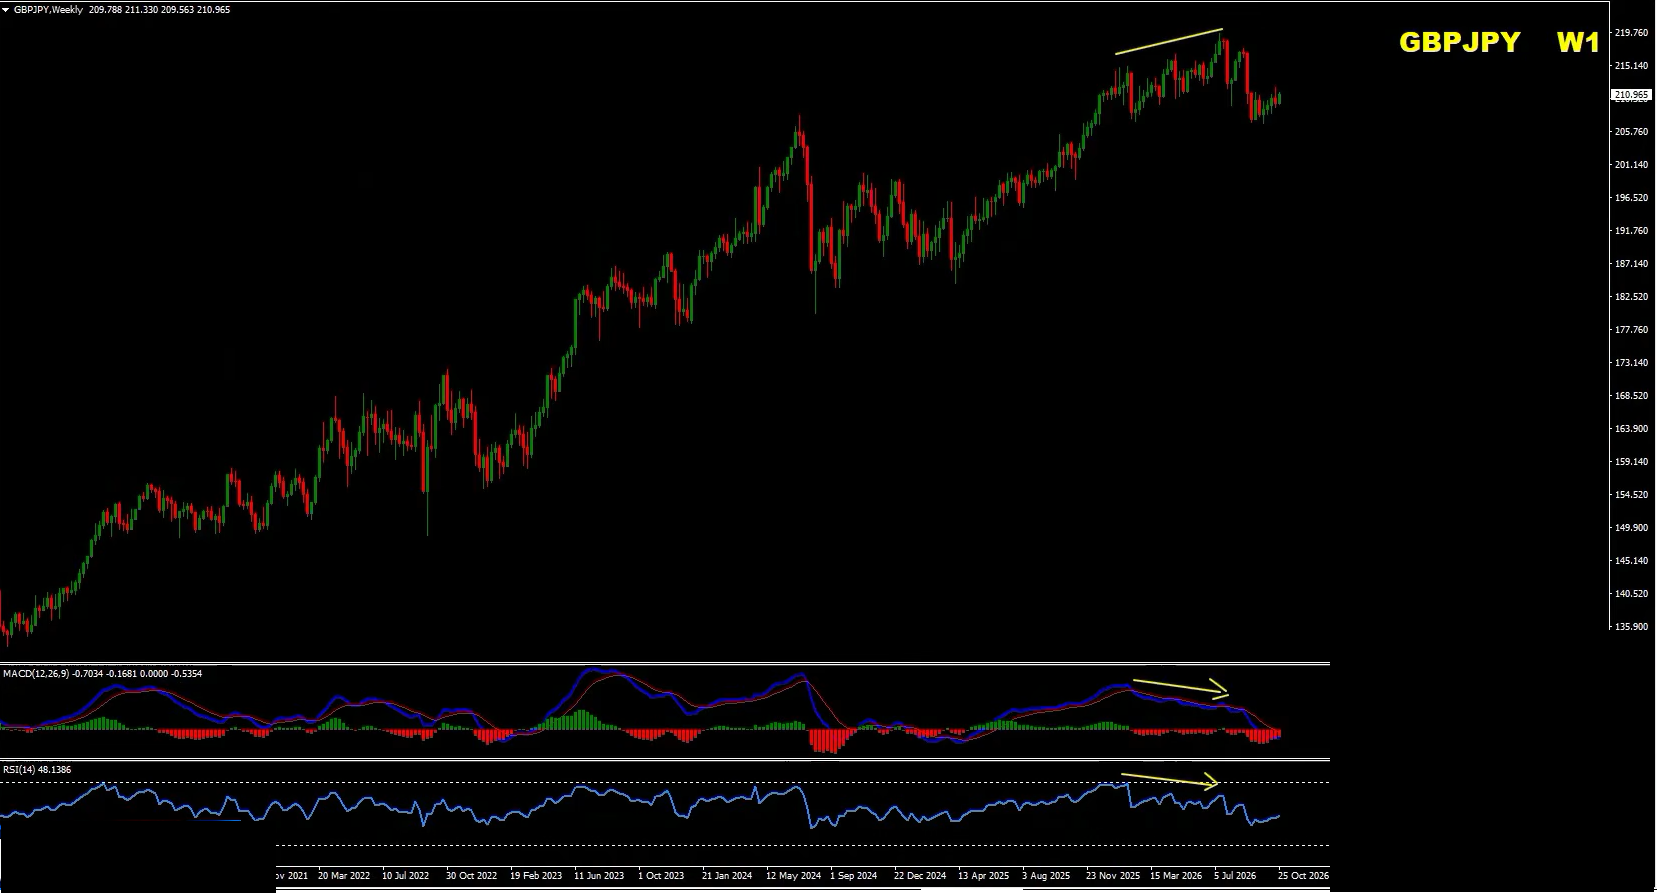
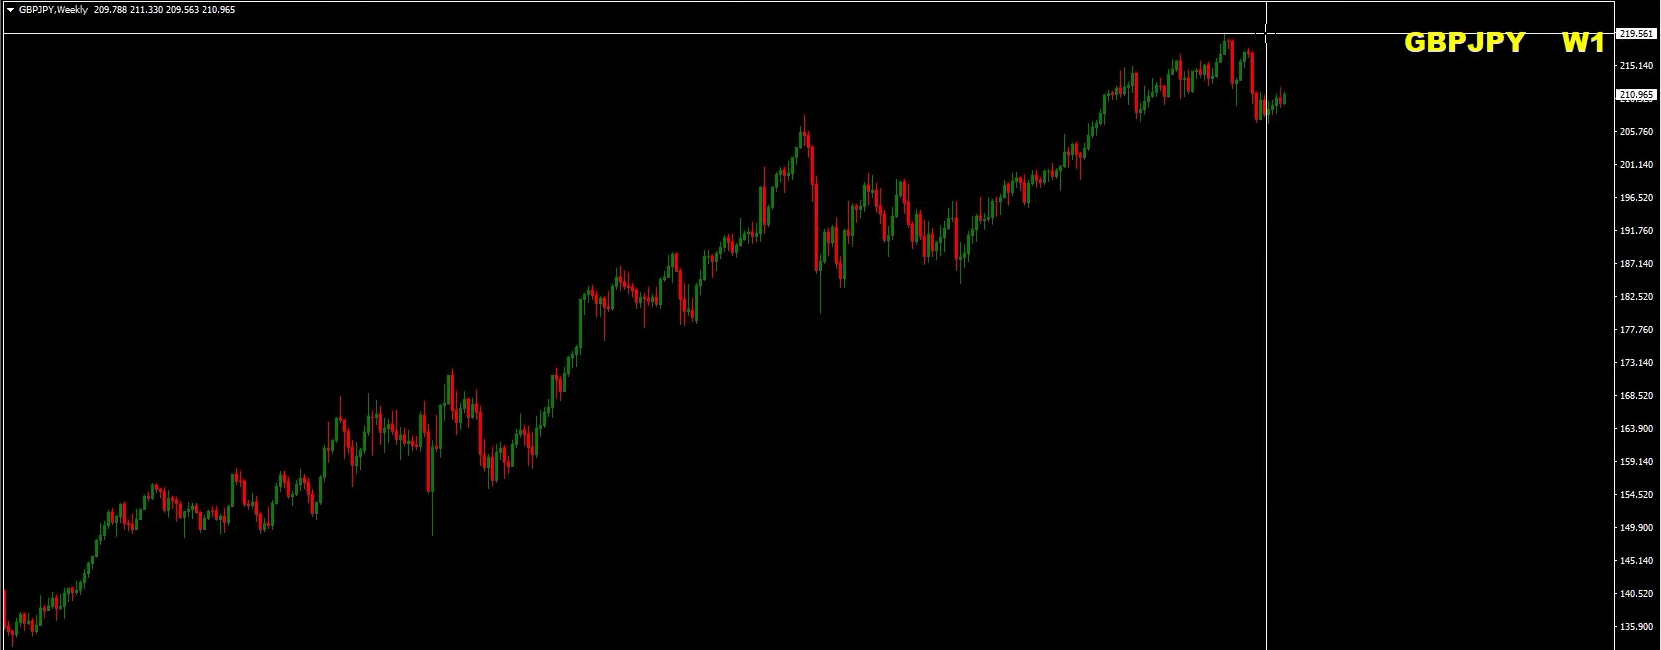
The pair has developed a very clear bearish divergence on the higher timeframes.
We have higher highs on the price chart, while MACD and RSI are showing lower highs.
This is a classical bearish divergence condition.
But there is more.
The pair recently attempted to push above the important psychological level of 215.00 and came very close to the major 220.00 area.
However, the breakout failed.
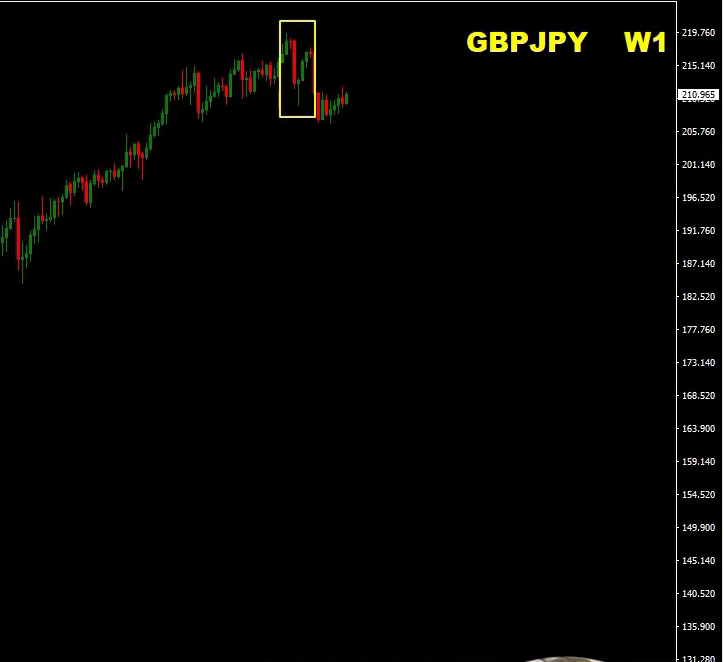
This false breakout is particularly interesting because it occurred alongside a bearish divergence.
We also have an evening star candlestick formation near the highs.
An evening star is a bearish reversal pattern that can indicate a potential transition from buying pressure to selling pressure.
When this pattern develops around an important resistance area and coincides with bearish divergence, it deserves attention.
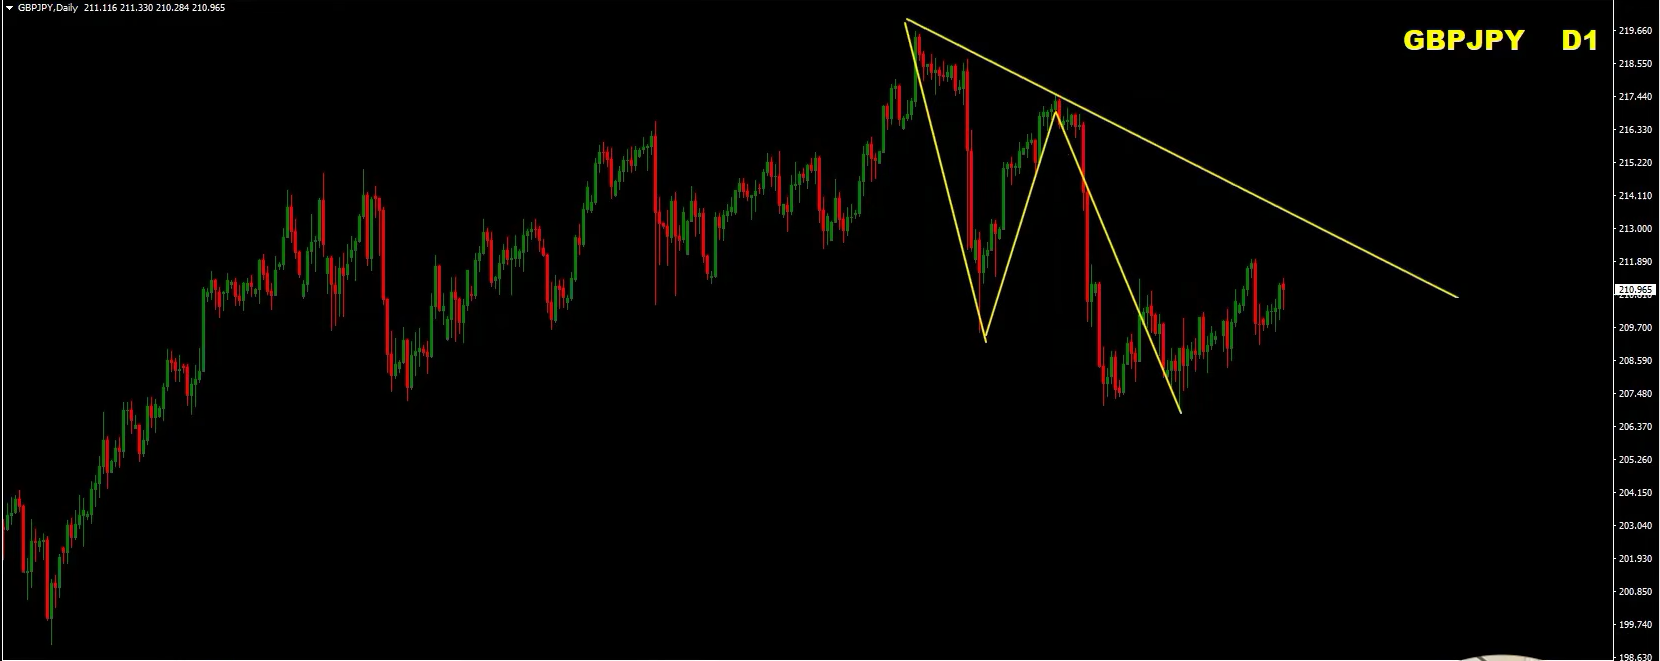
Moving to the daily timeframe, we can already identify bearish waves developing.
Price is beginning to create:
There is also an important structural development.
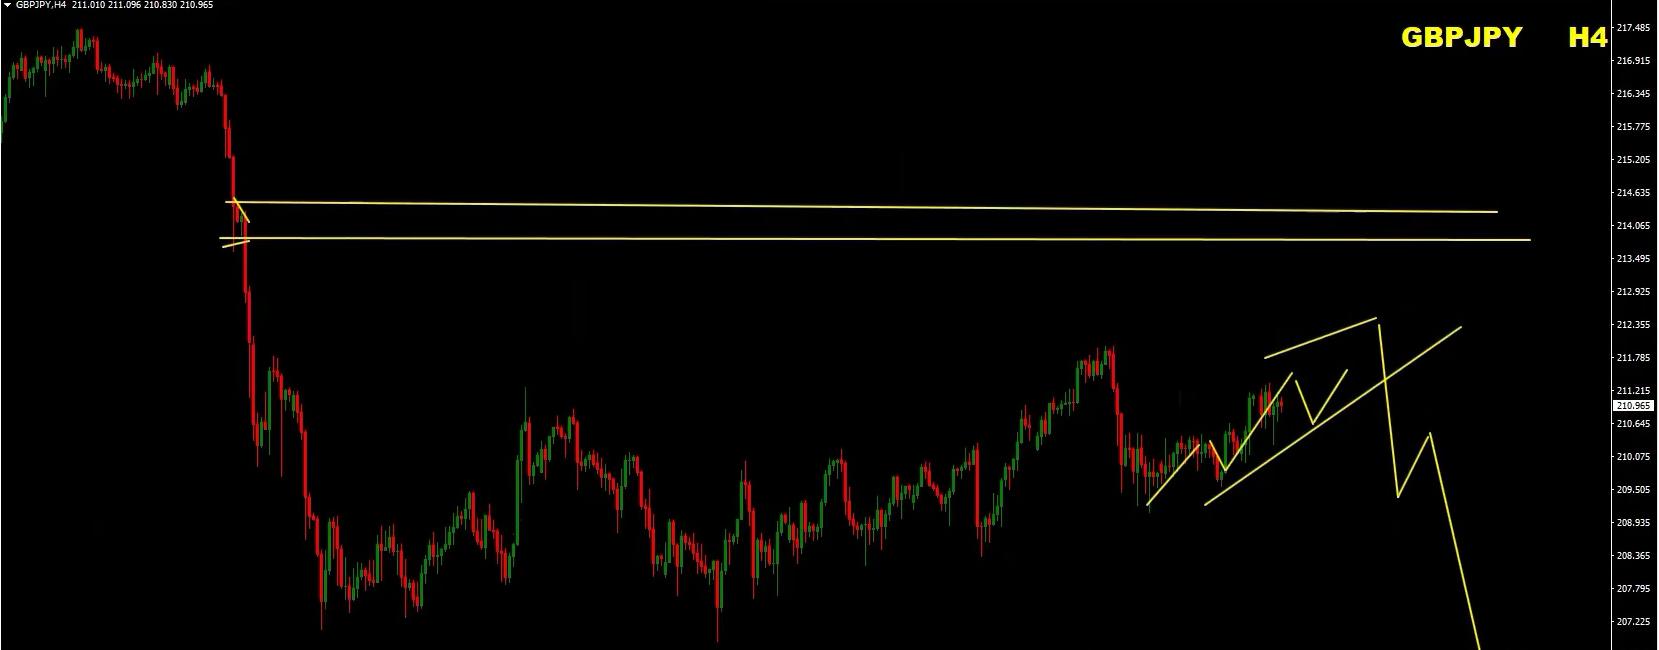
A previous low has been broken, meaning the corresponding swing high can now act as a major supply zone.
This creates an interesting combination of technical factors.
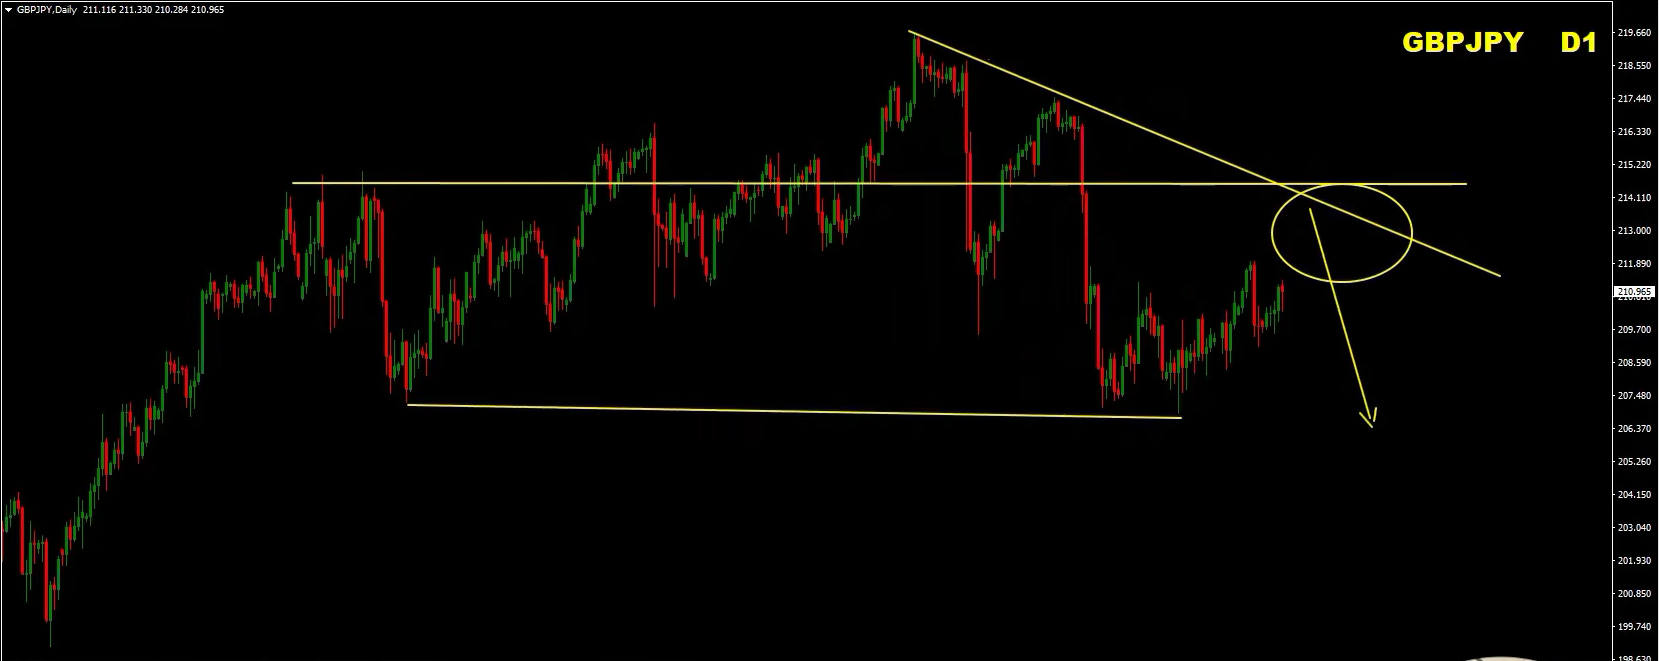
We have a falling resistance line, a major supply area, and bearish momentum developing on the daily chart.
The area where these technical factors overlap is my preferred zone for looking for selling opportunities.
I am particularly interested in seeing GBP/JPY complete a corrective move toward resistance before sellers regain control.
Scenario 1: Corrective Rally Followed by a Sell-Off
The ideal scenario would be for GBP/JPY to complete a few corrective waves toward the resistance zone.
If bearish divergence, an evening star, or another clear bearish reversal pattern develops, I would start looking for selling opportunities.
Scenario 2: Consolidation Followed by a Breakdown
Another possibility is that price consolidates below the resistance zone, breaks the consolidation structure to the downside, and resumes its bearish momentum.
As long as the major resistance and supply area hold, I remain interested in selling opportunities.
My GBP/JPY view: I am bearish and prefer selling the rallies rather than chasing the market lower.
The combination of higher-timeframe bearish divergence, a failed breakout, and the emerging daily bearish structure makes this a market worth watching closely.
Trading Bias: Bearish in the Longer Term – Watching for a Potential Short-Term Bounce
Let’s move to gold.
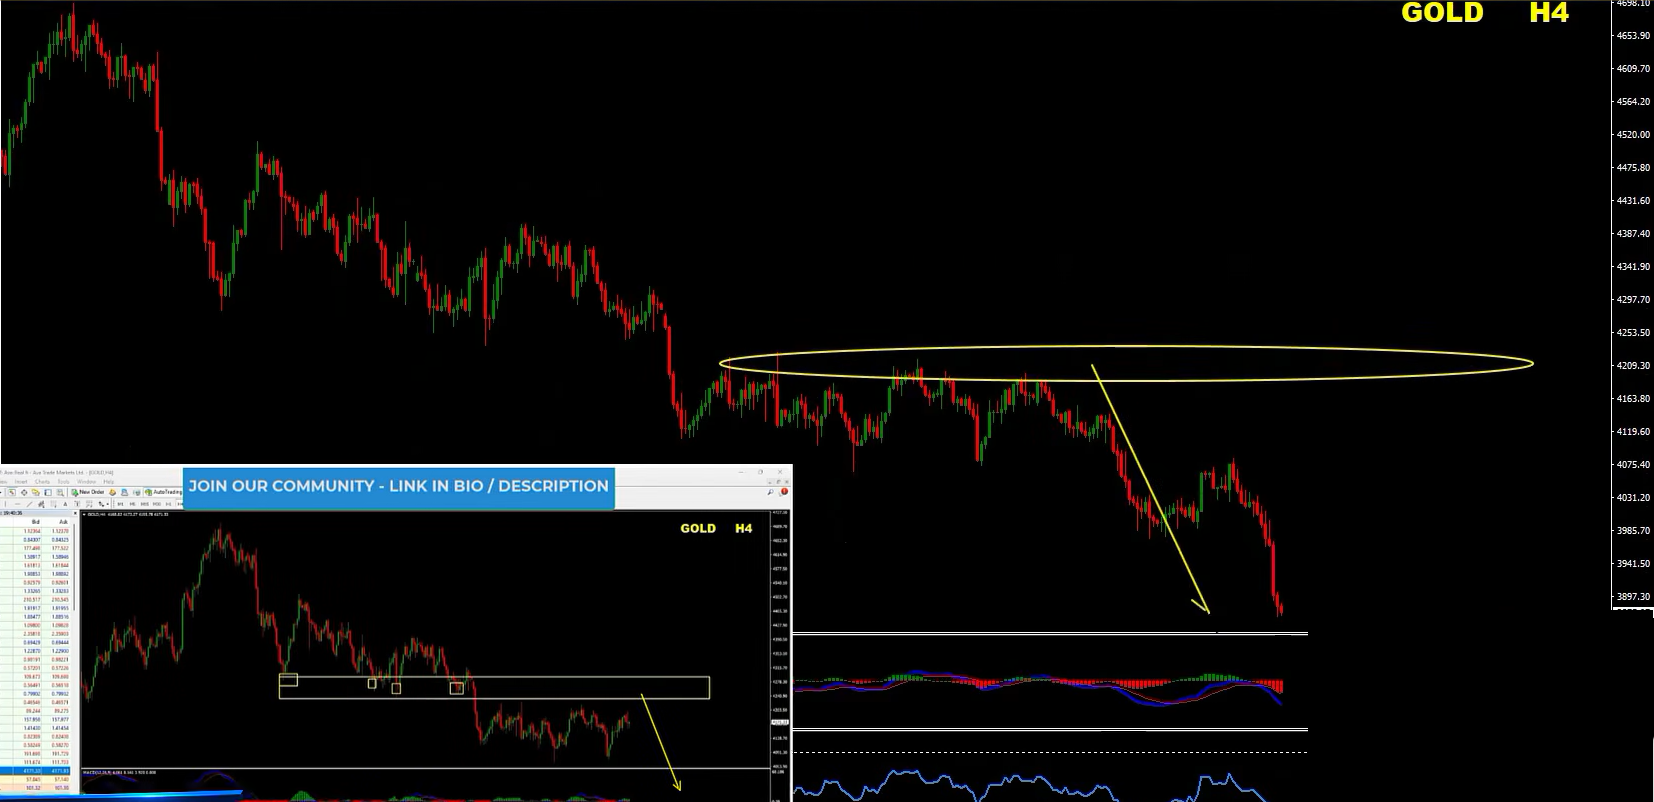
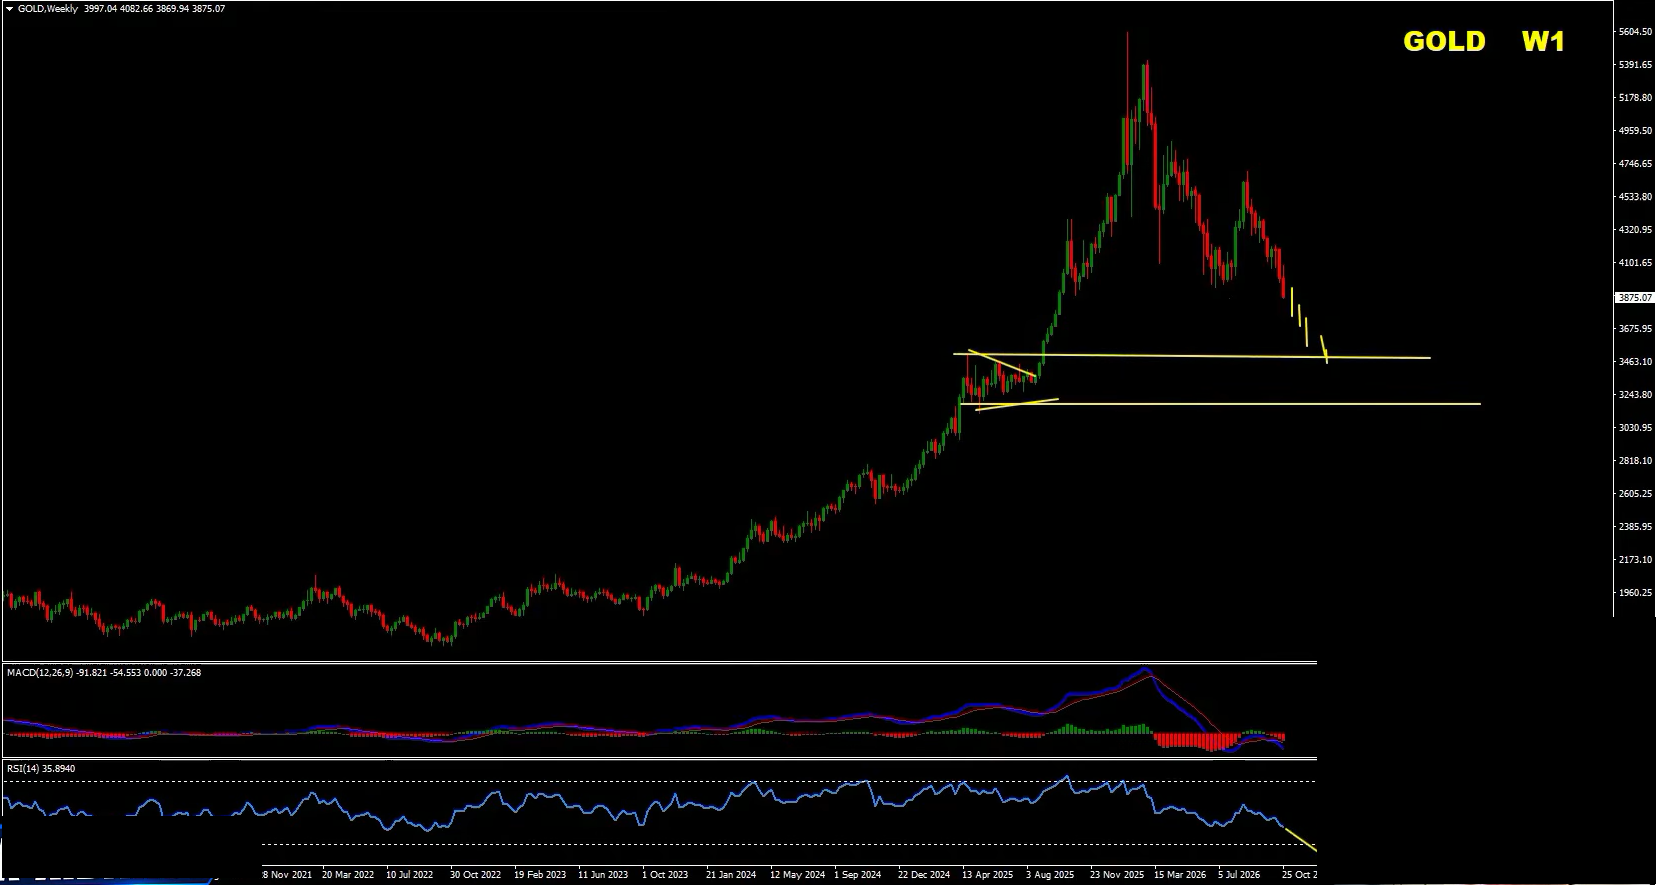
In our previous weekly forecast, I explained why I was extremely bearish on gold and identified the important technical area where I expected sellers to take control.
Gold respected that area and eventually moved lower.
Now the biggest question is: how much further could gold fall?
There are two important possibilities that I am watching.
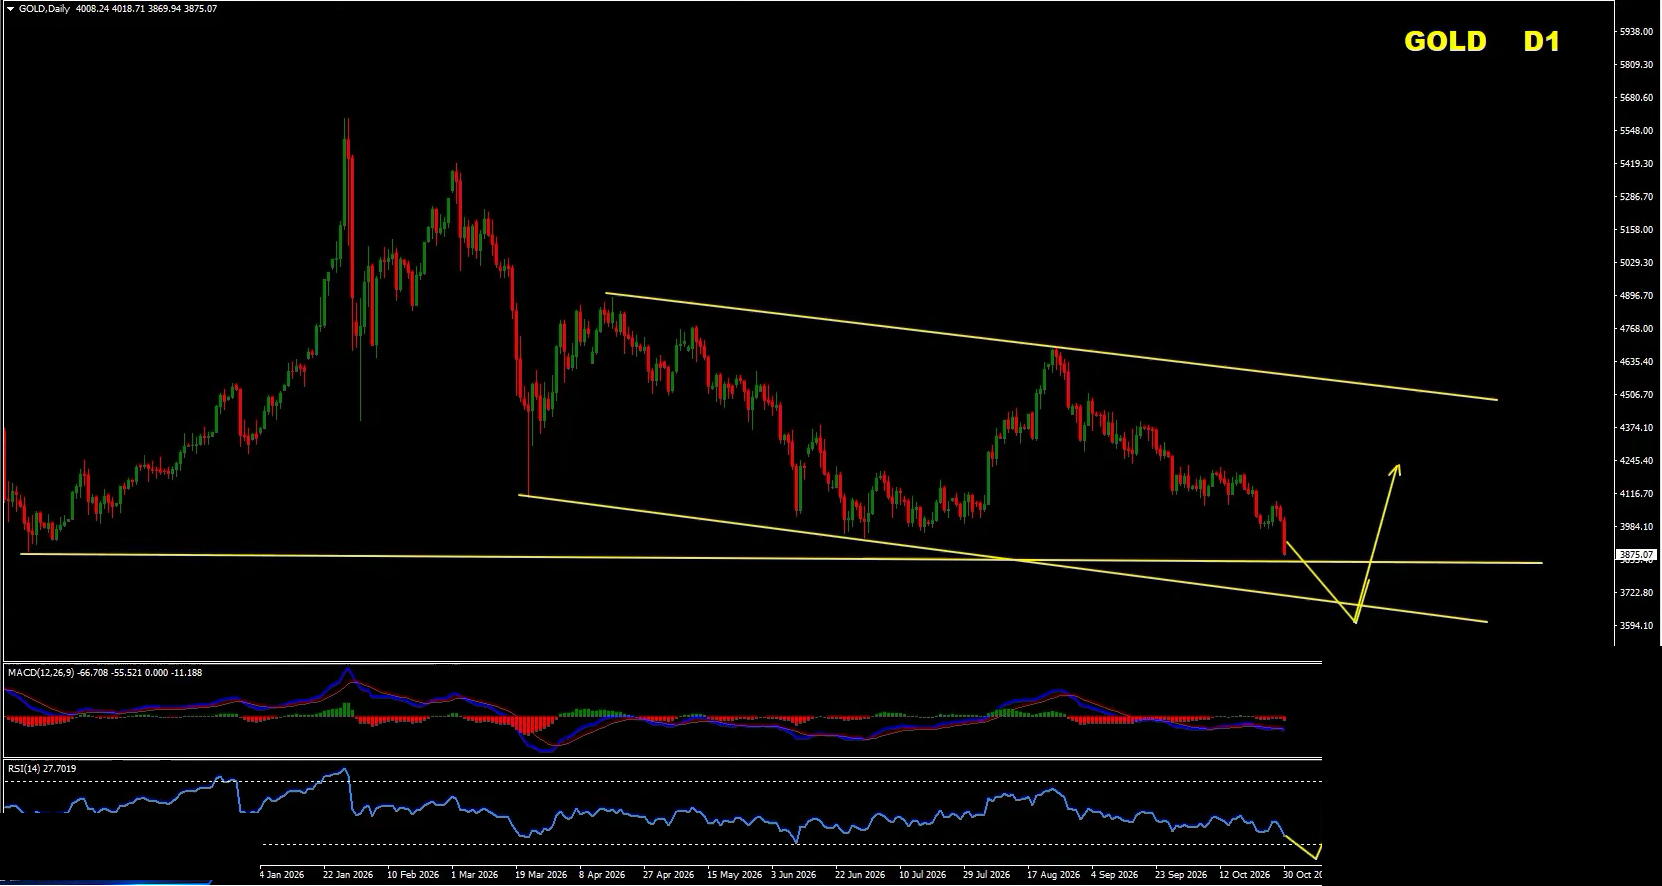
The first possibility is that gold starts developing a bearish-move exhaustion pattern.
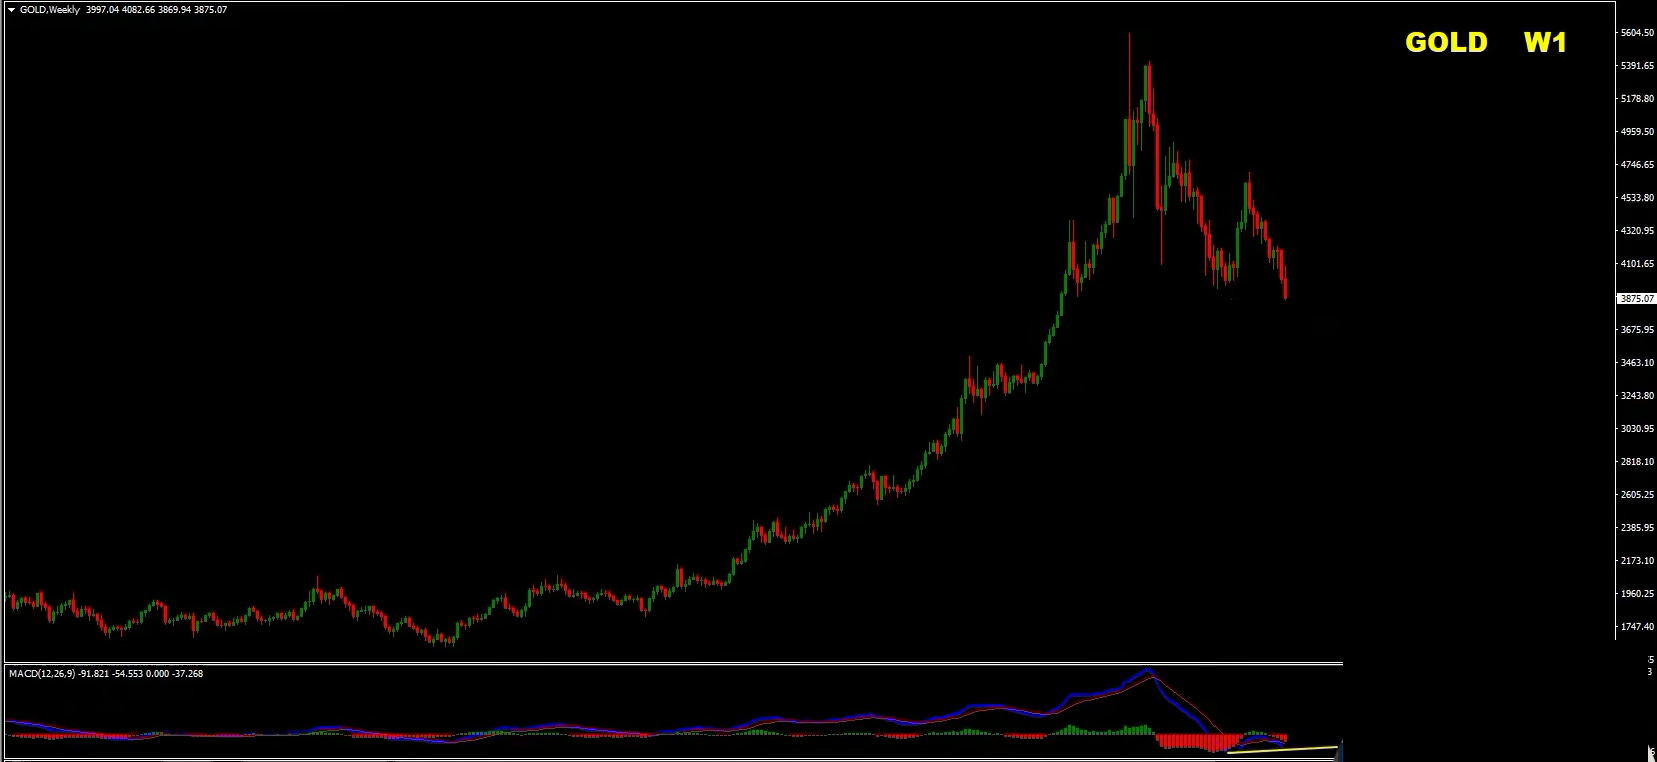
We could potentially see bullish divergence developing as price approaches the next important support area.
However, I want to be very clear about something.
The bullish divergence is not confirmed yet.
There is a possibility that gold simply continues crashing without developing a meaningful divergence.
If bullish divergence develops and receives confirmation from price action, we could start looking for a recovery.
If it does not, I would not attempt to buy simply because the market has already fallen significantly.
This is the scenario I believe traders should take seriously.
Gold could continue its bearish movement and retest the major historical weekly range around 3,500, potentially extending toward 3,000.
These are important longer-term reference areas.
As gold approaches these levels, I would pay particular attention to RSI.
If RSI reaches oversold territory and this condition aligns with bullish reversal signals on the lower timeframes, we could have an interesting opportunity to look for buying positions.
On the shorter timeframes, I am also watching the dynamic support line within the current bearish channel.
If gold reaches the lower boundary of this channel, particularly after sweeping the previous lows, we could see a temporary bounce.
An oversold RSI condition would add further interest to this setup.
However, I would distinguish between a temporary technical bounce and a genuine long-term trend reversal.
The broader bearish outlook remains intact until the daily and weekly charts provide convincing reversal confirmation.
My Gold view: I remain bearish in the longer term. I am interested in selling opportunities while the bearish structure remains intact, but I will also monitor the lower channel boundary for potential short-term bounces.
The 3,500–3,000 area is an important zone I will be watching for possible longer-term buying opportunities.
Trading Bias: Bearish – Sell the Rallies
Now let’s take a look at the S&P 500.
Remember our previous weekly forecast, where we discussed the possibility of selling the rallies?
The market has developed in a way that continues to support my bearish outlook.
My view has not changed.
I remain bearish on the S&P 500, and there are several technical and fundamental factors behind this position.
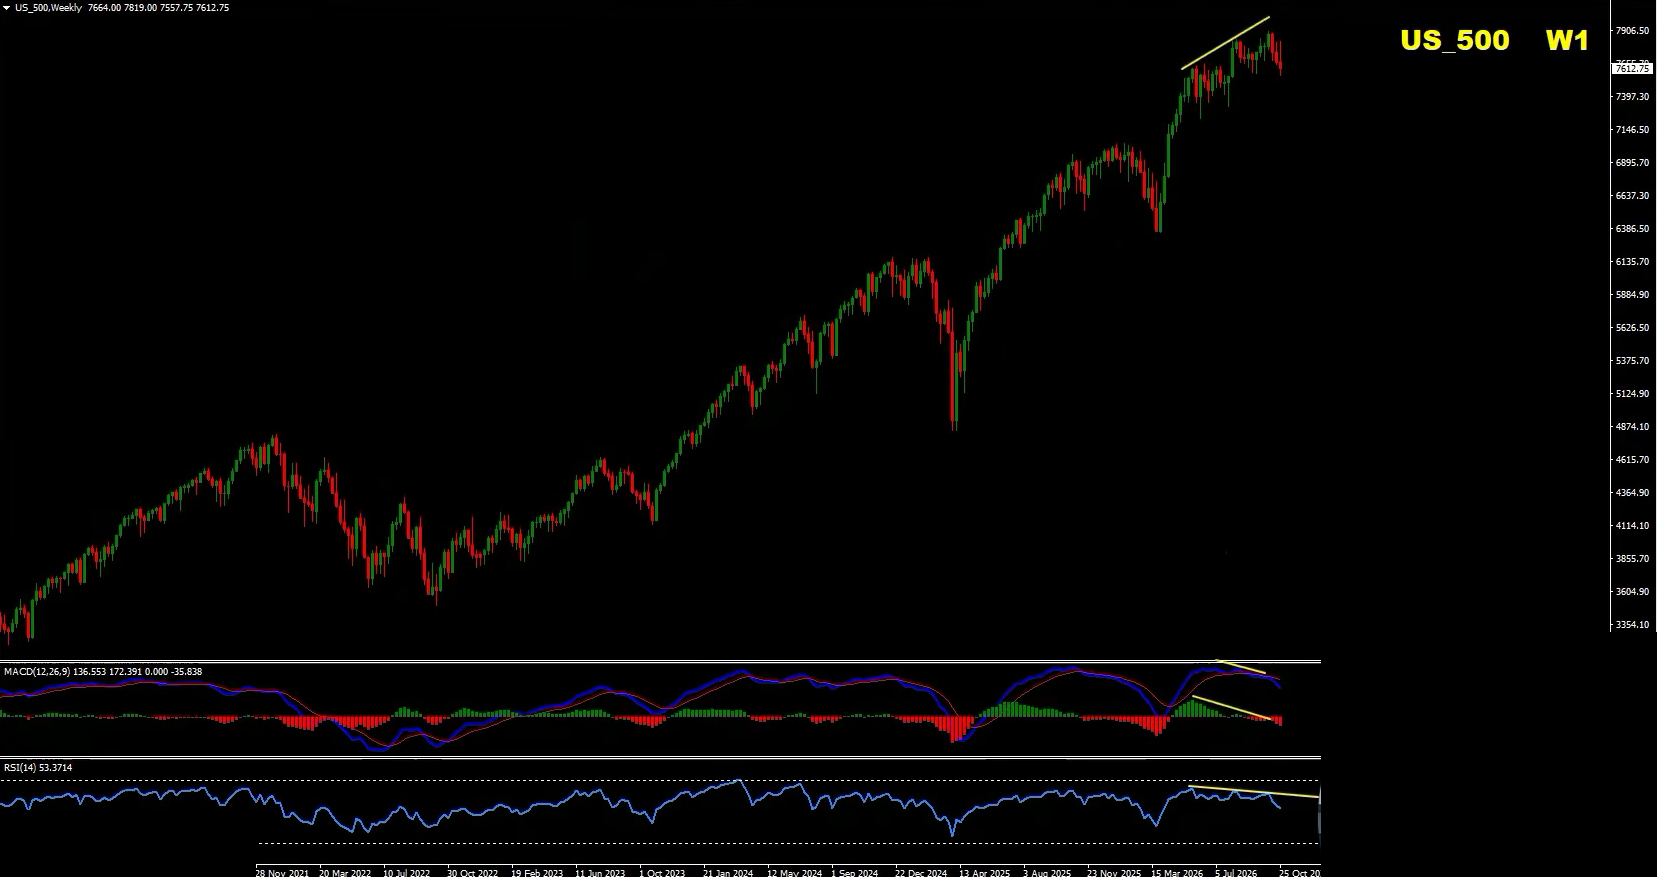
The first important factor is the weekly chart.
We have bearish divergence developing on both MACD and RSI.
This means that while price has been attempting to maintain its bullish structure, the underlying momentum indicators are showing weakness.
When both indicators start confirming a weakening momentum structure, it is something I do not want to ignore.
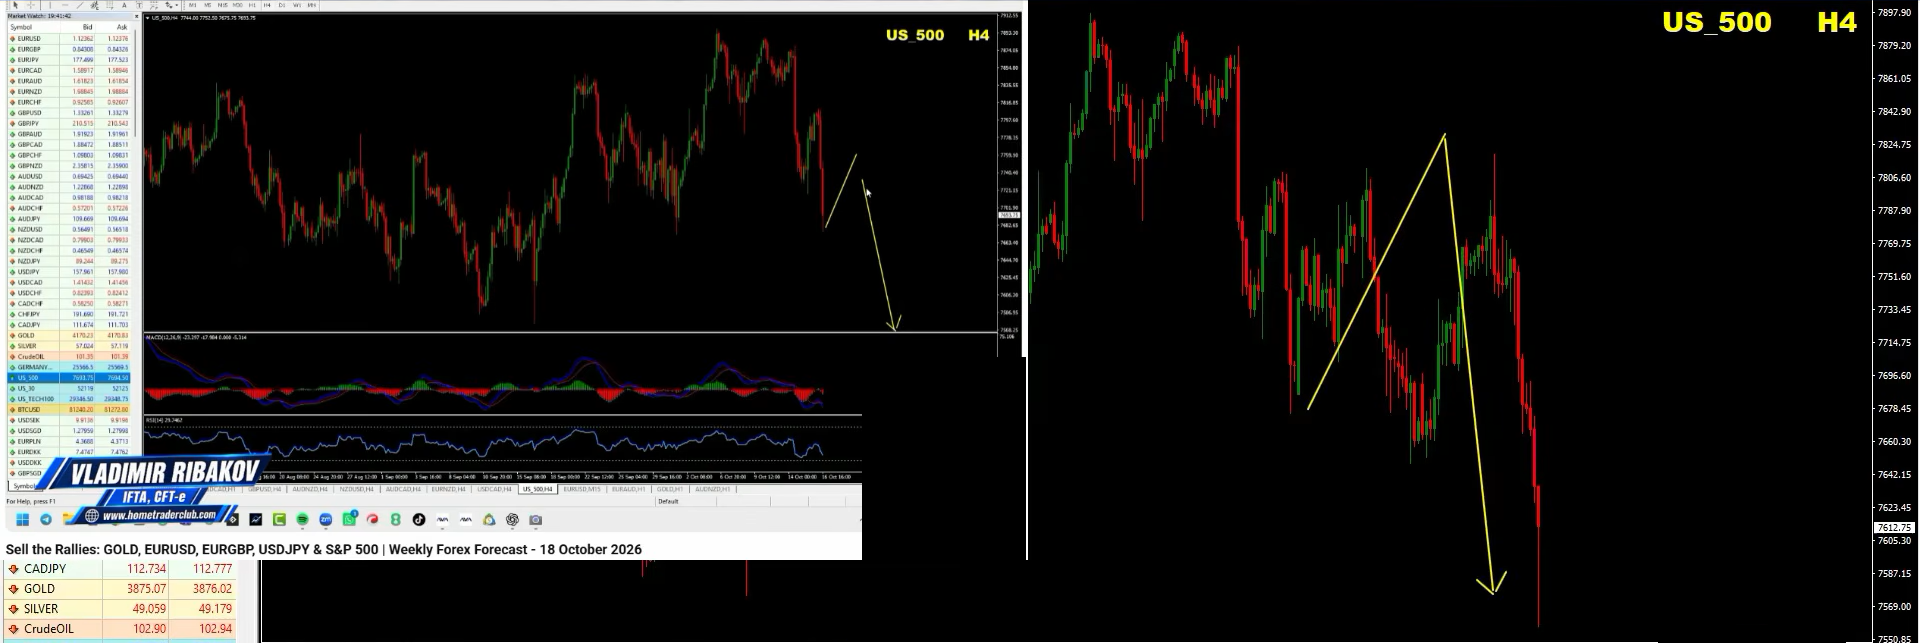
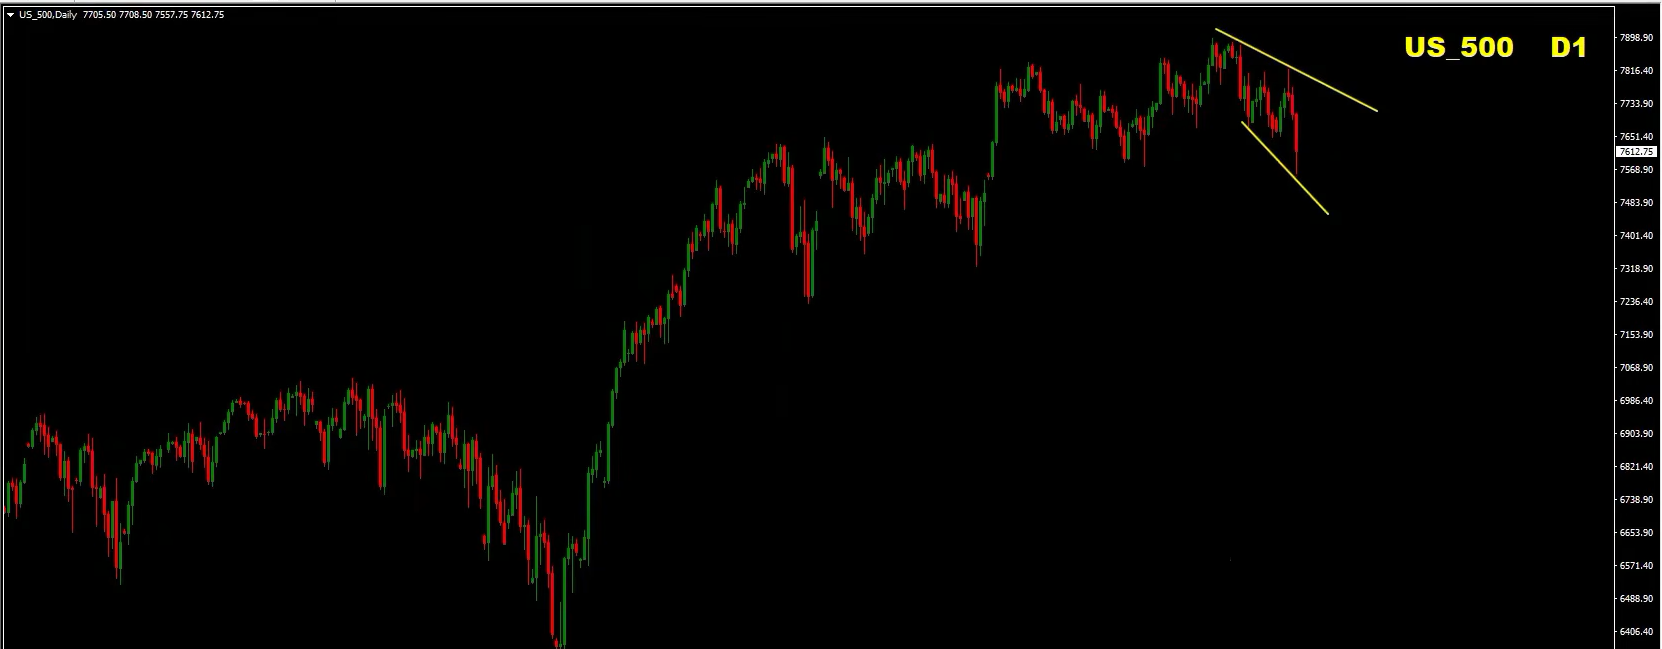
The daily chart is also becoming increasingly interesting.
We are starting to see a sequence of lower highs and lower lows.
This is an important indication that the short-term market structure is shifting toward the downside.
Another concern is the recent weakness in individual companies.
For example, the sharp decline in Intel, highlighted in the video, demonstrates how quickly selling pressure can develop in individual stocks.
We also have broader geopolitical and political uncertainties that could contribute to market volatility.
While these fundamental developments do not guarantee a market decline, they add to the reasons I am cautious about the broader equity market.
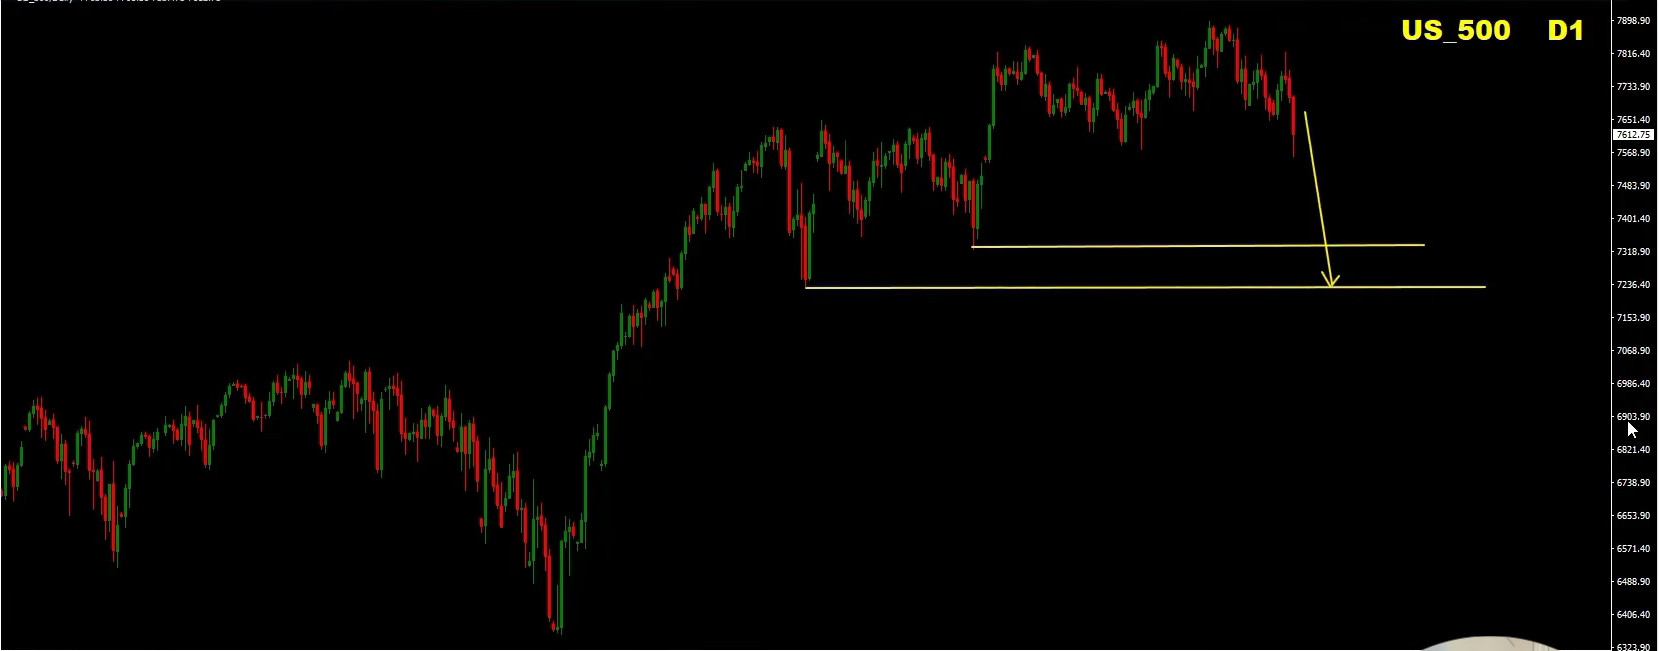
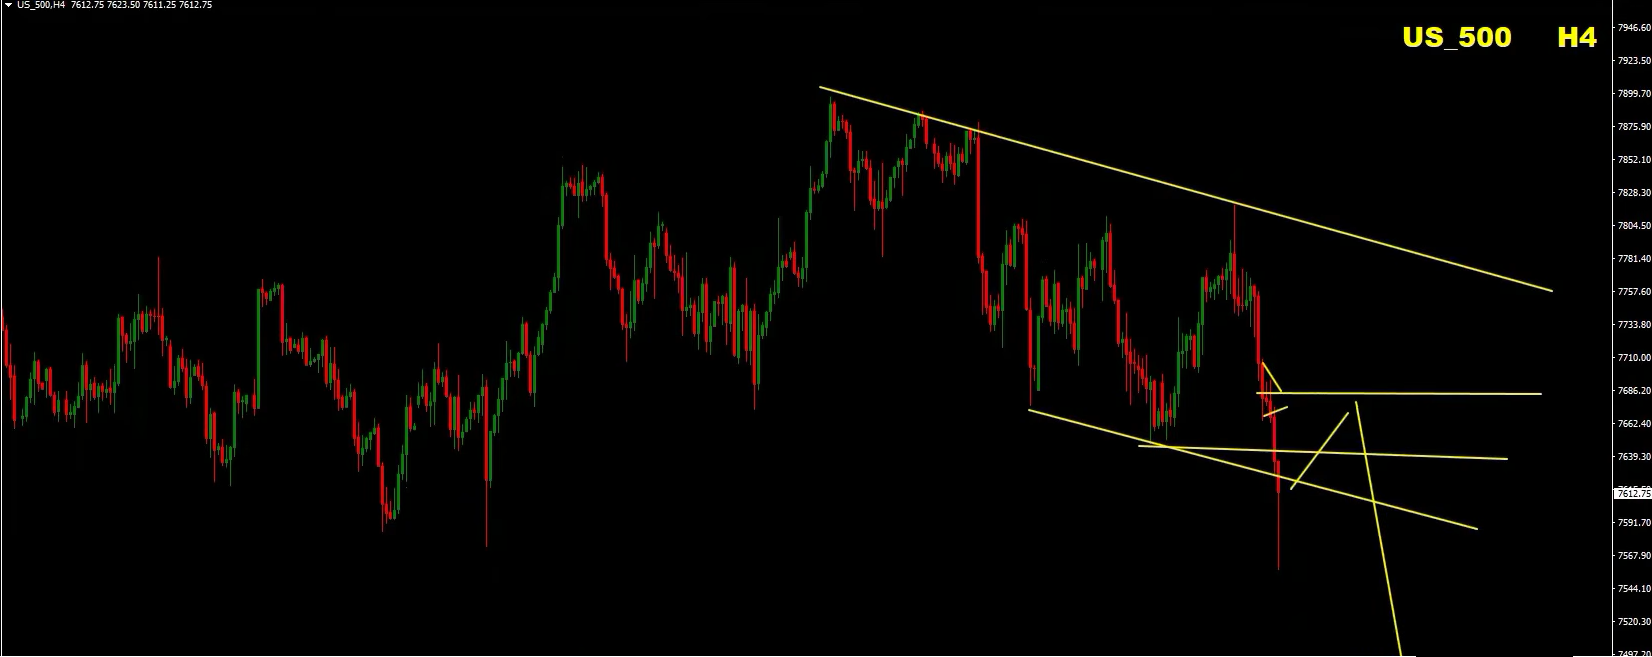
The area around 7,650–7,700 is particularly important.
We have previously broken support that could now act as resistance, and price is currently attempting to challenge this structure.
This is a significant supply area.
As long as this resistance holds, I prefer looking for selling opportunities rather than buying the rallies.
The first important downside area I am watching is around 7,300.
Beyond that, the next potential target is approximately 7,200.
However, there is another possibility.
If the bearish momentum accelerates and the daily structure continues to deteriorate, we could eventually see the S&P 500 moving below 7,000.
For now, I want to see how price behaves around the first major support areas.
My preferred approach is straightforward.
I want to see price rally toward resistance and then look for bearish confirmation.
If the resistance zone holds and the lower-timeframe structure confirms the downside, that could provide an interesting selling opportunity.
I do not currently see convincing reversal signals that would make me change my broader bearish outlook.
My S&P 500 view: Sell the rallies. As long as the 7,650–7,700 resistance area holds, I remain bearish, with 7,300 and 7,200 as the next important downside references.
Trading Bias: Short-Term Bearish, Watching for a Potential Buy Setup
Finally, let’s talk about Bitcoin.
In our previous forecast, we discussed looking for selling opportunities around the important resistance areas.
The broader bearish view remains relevant, but I believe an interesting buying opportunity could be approaching.
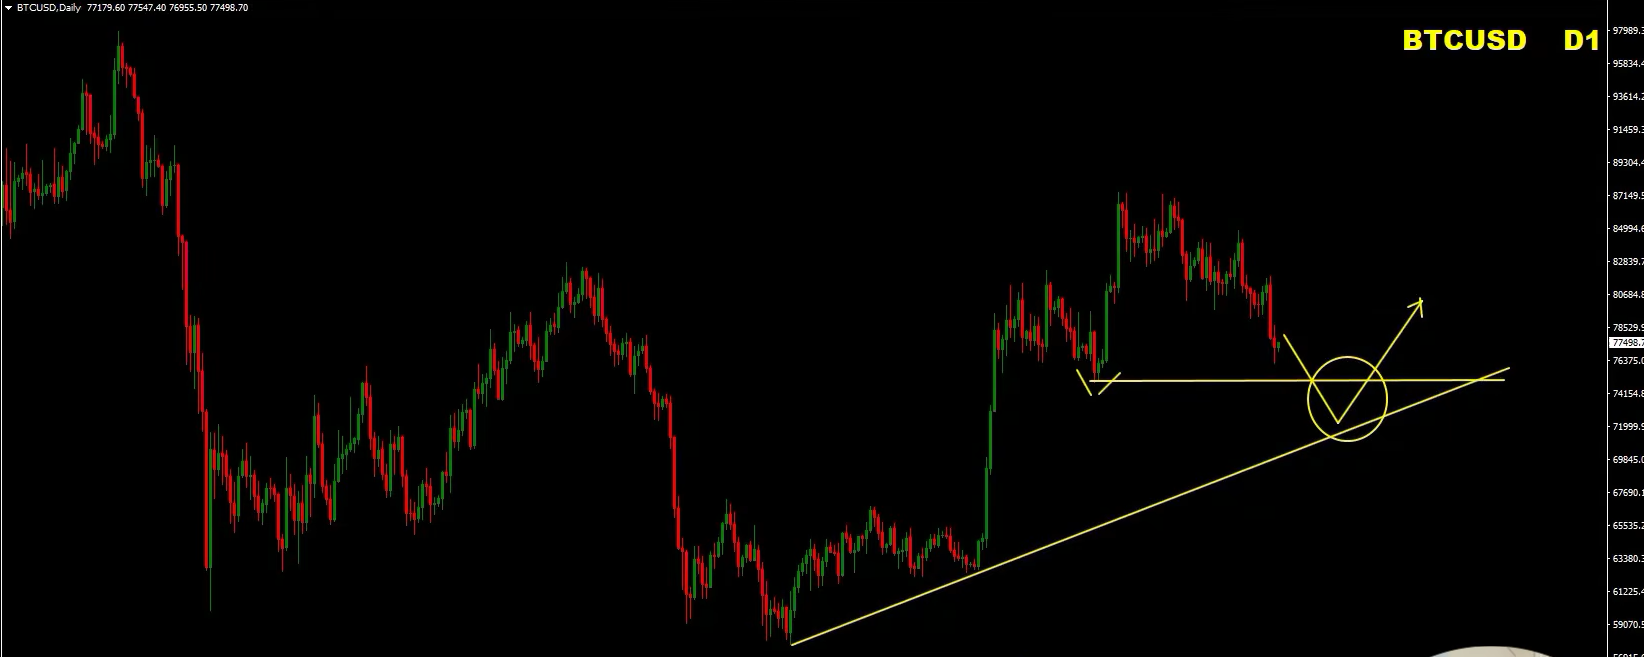
On the daily chart, we have a rising support line and an important previous low.
This low is particularly interesting because it could act as a liquidity zone.
My preferred scenario is to see Bitcoin move toward this area, potentially sweep the previous low, and then start developing signs of a bullish reversal.
Why is this important?
Markets frequently move beyond obvious highs and lows to collect liquidity before changing direction.
A liquidity sweep can sometimes create an opportunity for traders who wait for confirmation rather than entering too early.
I am particularly interested in the following sequence:
Step 1: Price Approaches the Previous Low
I want to see Bitcoin move toward the important daily support and liquidity area.
Step 2: A False Breakdown Develops
Ideally, price moves below the previous low but fails to maintain that breakdown.
This could create a liquidity sweep.
Step 3: Bullish Divergence Appears
On the lower timeframes, I will be looking for price to form lower lows while MACD or RSI forms higher lows.
This would indicate that bearish momentum could be weakening.
I would start looking for buying opportunities.
This is the type of setup I want to see rather than attempting to catch a falling market.
My Bitcoin view: I still consider the broader structure bearish, but a liquidity sweep followed by bullish divergence could create an interesting short-term buying opportunity.
This is one of the setups I will be watching particularly closely.
This week’s market outlook is particularly interesting because we are seeing different stages of market development across several instruments.
EUR/USD could be approaching the end of its bearish move, potentially preparing for a recovery toward 1.14–1.15.
GBP/JPY is showing a convincing bearish structure, and I prefer selling rallies while the important resistance and supply zones remain intact.
Gold continues to offer an interesting longer-term bearish opportunity, with 3,500–3,000 being an important area to monitor for potential buying opportunities in the future.
The S&P 500 remains one of my strongest bearish views, and I will continue looking for selling opportunities around resistance.
Finally, Bitcoin could provide an interesting short-term buying opportunity if we see a liquidity sweep followed by bullish divergence and structural confirmation.
Now I would like to hear from you!
Which of these five markets do you find the most interesting?
Are you watching EUR/USD for a bullish reversal? Do you agree with my bearish outlook on GBP/JPY and the S&P 500? Or do you think Bitcoin is preparing for a recovery?
Share your thoughts and trading ideas in the comments below.
If you are new to our channel, make sure you subscribe and hit the like button. Your comments and feedback are always appreciated.
And if you want to take your trading further, I would like to invite you to join our trading family at Home Trader Club.
You will find comprehensive trading courses, real-time trading opportunities, and ongoing trading education designed to help you become a more confident and disciplined trader.
Visit https://www.hometraderclub.com and join our community.
Thank you for watching, traders.
Best to you and yours, and I’ll see you soon with more good trading!
Vladimir Ribakov
Internationally Certified Financial Technician
Home Trader Club
Trading Forex, CFDs, indices, commodities, cryptocurrencies, and other financial instruments involves significant risk and may not be suitable for every investor. Leverage can magnify both profits and losses. The market analysis, forecasts, and trading scenarios presented in this article are for educational and informational purposes only and should not be considered investment advice or a recommendation to buy or sell any financial instrument.
Always conduct your own research, use appropriate risk management, and never risk more than you can afford to lose.
When Being Right Becomes More Important Than Making Money Every Forex trader wants to make…
Why Doesn't a Strong Economy Always Have a Strong Currency? Imagine that a country reports…
Have you ever opened your trading platform, watched the market move, and felt that you…
Employment data is one of the most important economic indicators in Forex fundamental analysis. It…
Welcome back to our weekly Forex forecast at Home Trader Club. This week, we are…
GDP growth is one of the most important indicators of economic health. But does stronger…