Forex trading is an exciting field with plenty of opportunities for traders to profit. However, like any other type of trading, it is important to have a strategy in place to ensure you make informed decisions when trading. One of the key components of a successful forex trading strategy is the use of technical indicators. Technical indicators are mathematical calculations based on an instrument’s price and are used to help traders make informed decisions about when to enter or exit a trade. A wide range of technical indicators are available, each with strengths and weaknesses. This article will discuss how to use technical indicators in forex trading.
I invite you to join our trading family (Home Trader Club) and enjoy the best of our REAL-TIME trading opportunities and our trading techniques and improve your trading with us.
As an Internationally Certified Financial Technician (CFTe, IFTA) and former private capital hedge fund trader, I have successfully mentored numerous students who are now thriving in the trading world. Students who learned with me, are now full-time traders, work in the trading industry, run their own capital firms or are fully funded traders by private companies, develop automated trading solutions and manage others’ capitals. I am a very proud mentor and I am proud of the success stories I’ve helped create, and for a limited time, I’m offering my mentorship program for free through a partnership with Eight Cap broker. Join Eight Cap, become an active trader, and choose the offer that suits you best –
For more details, visit: Home Trader Club Mentorship Program
I’m excited to work with you and help you reach your desired level of success!
Before diving into how to use technical indicators, it is important to understand what they are and how they work. Technical indicators are tools that traders use to analyze price movements in order to make informed trading decisions. These indicators are typically based on mathematical calculations that use price and/or volume data to determine trends, momentum, and other key factors that can help traders make better decisions.
There are many types of technical indicators, each with strengths and weaknesses. Some of the most popular technical indicators used in forex trading include MACD, volume profile (KTLI), moving averages, Bollinger Bands, Relative Strength Index (RSI), and the Stochastic Oscillator. Each of these indicators can be used differently to help traders identify potential trading opportunities and manage risk.
Technical indicators can be broadly divided into two categories: lagging indicators and leading indicators. Lagging indicators are based on past market data and are used to confirm trends that have already been established. Leading indicators, on the other hand, are used to predict future price movements and are based on current market data.
Now that we have a basic understanding of technical indicators, let’s explore how to use them effectively in forex trading.
The first step in using technical indicators in forex trading is to choose the right indicator for your trading strategy. As I mentioned earlier, there is a wide range of technical indicators available, and each one has its own strengths and weaknesses.
When selecting an indicator first, it is important to consider your trading style. If you are a day trader, you may want to use a short-term indicator that provides real-time data. If you are a swing trader, you may want to use a longer-term indicator that provides a broader market perspective.
Short-term Indicator
A short-term indicator, is a statistical or mathematical tool used to analyze near-term market or trends. It provides insights into the current state of the market or economy and helps traders, investors, and analysts make short-term decisions. Short-term indicators typically focus on a relatively brief time frame, ranging from a few days to a few months. They are used to assess the momentum, volatility, and sentiment of the market.
Examples of short-term indicators are:
Relative Strength Index (RSI), Stochastic Oscillator, Bollinger Bands, etc…
Long-term Indicator
A long-term indicator, is a statistical or mathematical tool used to analyze and predict trends over an extended period. Unlike short-term indicators, which focus on near-term market movements, long-term indicators provide insights into broader market or economic conditions and are used for making decisions over longer time horizons. Long-term indicators typically consider data over months, years, or even decades to identify overarching trends and cycles.
Examples of long-term indicators are:
Moving Averages, MACD, etc…
Here is one of my useful books which you can use to find what type of trader are you?
Another factor to consider when choosing technical indicators is the type of analysis you want to perform. Some indicators, such as moving averages, are better suited for trend analysis, while others, such as RSI and Stochastic Oscillator, are better suited for momentum analysis. By understanding the type of analysis you want to perform, you can choose the technical indicators that will be most effective in helping you achieve your trading goals.
You can find my top five favourite indicators that I use in my day to day technical analysis here
Once you have selected an indicator, it is important to understand the signals it provides. Each indicator has its own set of signals, and understanding these signals is crucial to use the indicator in your trading strategy effectively.
For example, a moving average indicator provides signals based on the crossover of different moving averages. A crossover of the short-term moving average above the long-term moving average is a bullish signal, while a crossover of the short-term moving average below the long-term moving average is a bearish signal.
(If you are not sure how to spot a moving averages crossover you can download and use our MACD indicator where the indicator provides a signal once the crossover happens.
You can download the MACD indicator for free here)
Understanding the signals provided by your chosen indicator is crucial in identifying trading opportunities and making informed trading decisions.
Key Tips On How To Use Technical Indicators In Forex Trading
When using technical indicators in forex trading, it is important to remember that no indicator is perfect. Technical indicators are simply tools to help traders analyze price action and identify potential trading opportunities. It is up to the trader to use these tools effectively and make informed decisions.
Here are some key tips on how to use technical indicators in forex trading:
First and foremost, you need to understand that no indicator can give you a complete picture of the market. Traders should use multiple indicators to confirm and increase the reliability of their analysis. For example, a trader could use the MACD indicator to identify a divergence and the Stochastic Oscillator to confirm potential overbought or oversold conditions.
Example 1
Bearish Divergence on MACD indicator and Stochastic Oscillator shows a potential overbought condition.
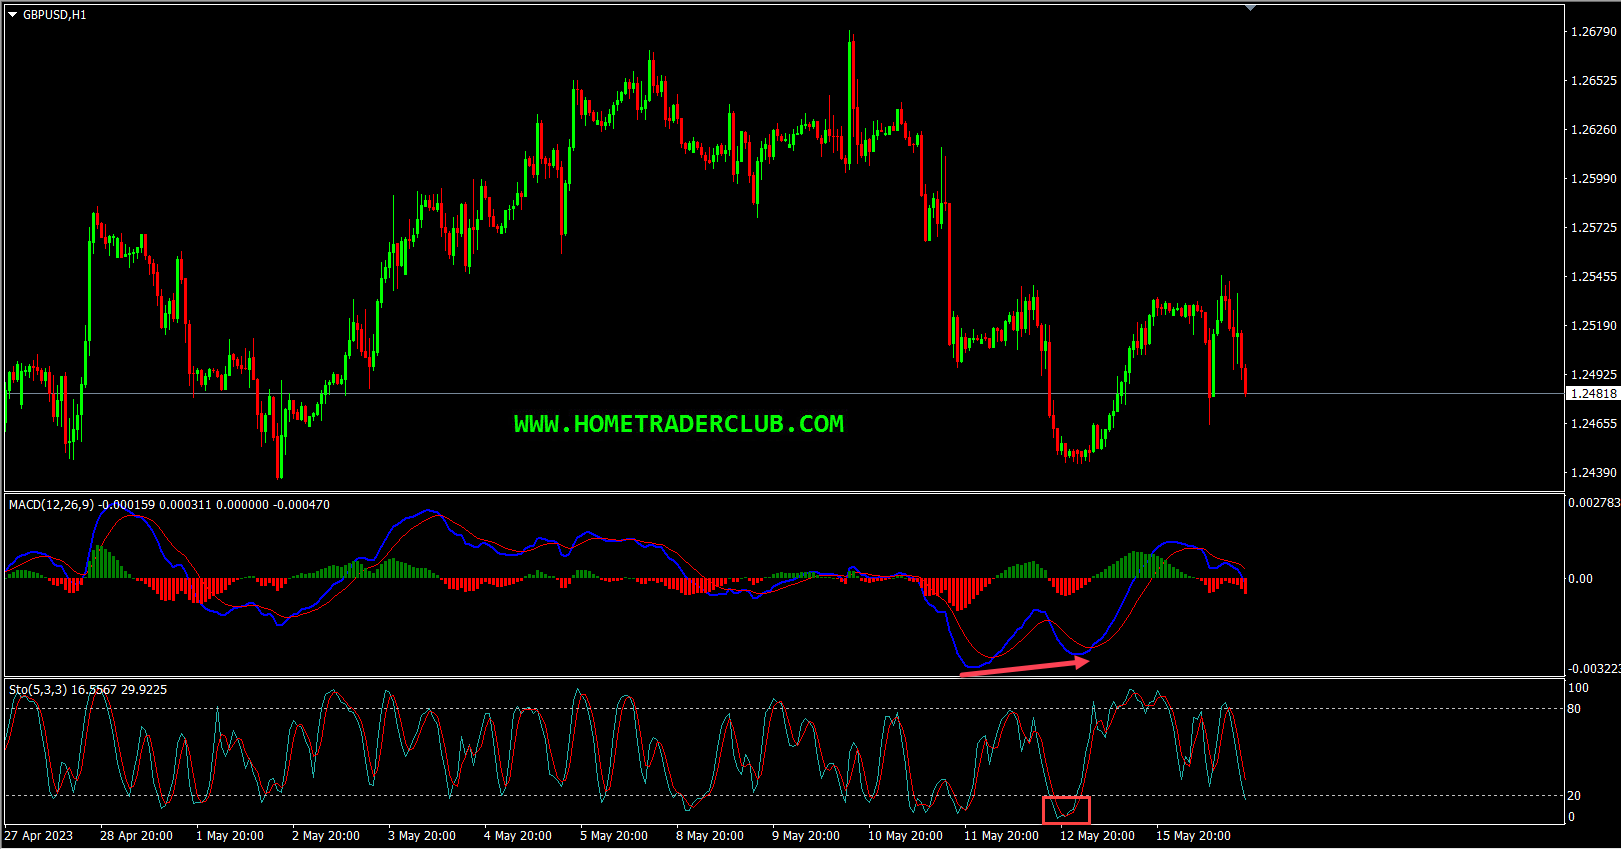
Example 2
Bullish Divergence on MACD indicator and Stochastic Oscillator shows a potential oversold condition.
if you want to learn more in-depth insights about divergences, you can benefit greatly from the videos on my channel here while also embarking upon Divergence University for comprehensive divergence education.
While technical indicators can be effective independently, they are often even more powerful when combined. By combining different indicators, traders can gain a more comprehensive view of the market and make more informed trading decisions. By using multiple indicators, traders can confirm signals and reduce the likelihood of false signals, which can help improve the accuracy of their trading decisions.
You can download my trading indicators here.
To understand the differences between our systems, check our road map here.
Traders should use indicators in different timeframes to better understand the market. For example, a trader could use the moving average in the daily and hourly charts to identify a long-term trends and short-term momentum.
In our Home Trade Club, we do our analysis based on the multi-timeframe analysis method; we look for the evidence on three timeframes that is on the current trading timeframe and two timeframes higher when we get evidence that supports our view on these three timeframes this makes the setup very reliable.
Example 1
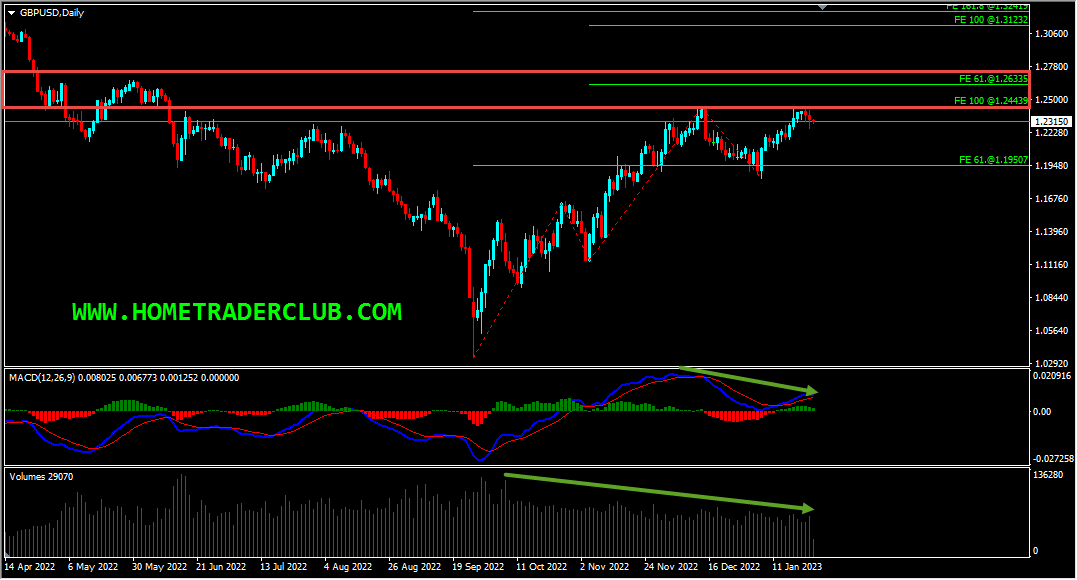
Price bouncing higher from a strong support zone, with bullish hidden divergence based on the MACD indicator in the daily chart.
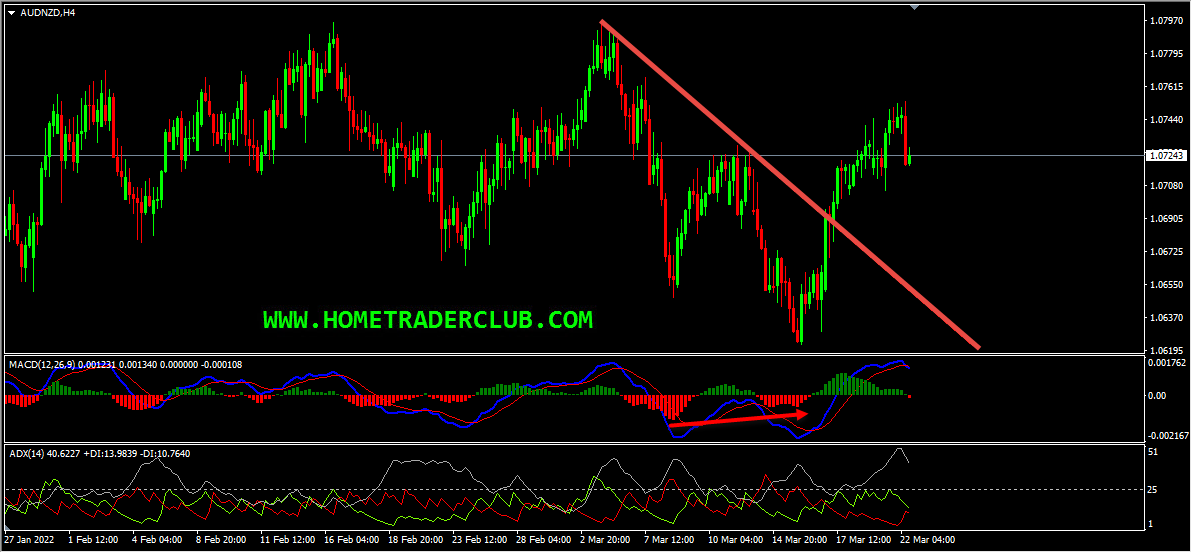
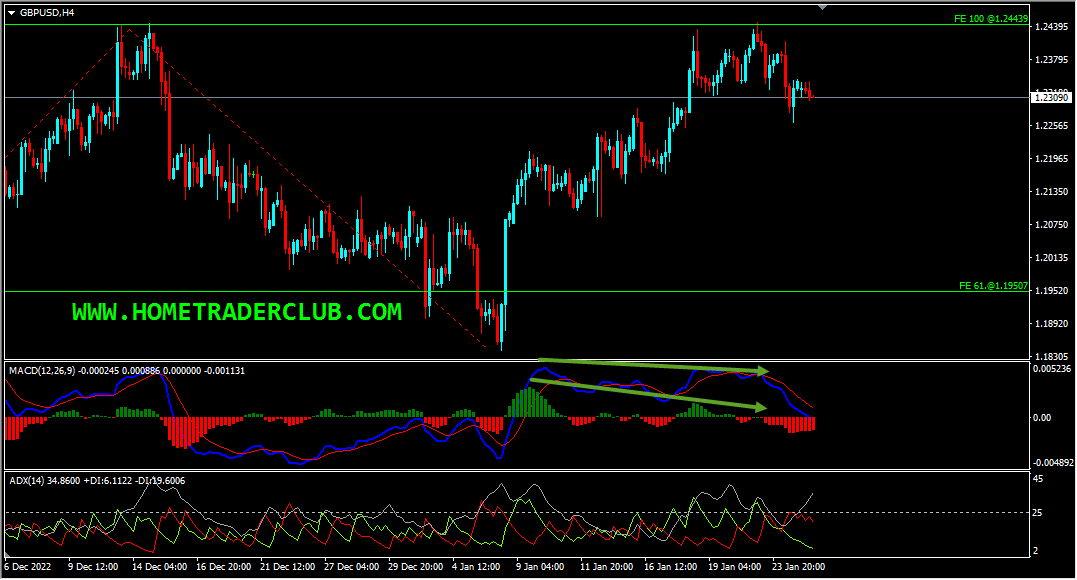
Bullish divergence based on the MACD indicator in the H4 chart, followed by the price breaking above the downtrend line and also the ADX indicator gave a bullish signal.
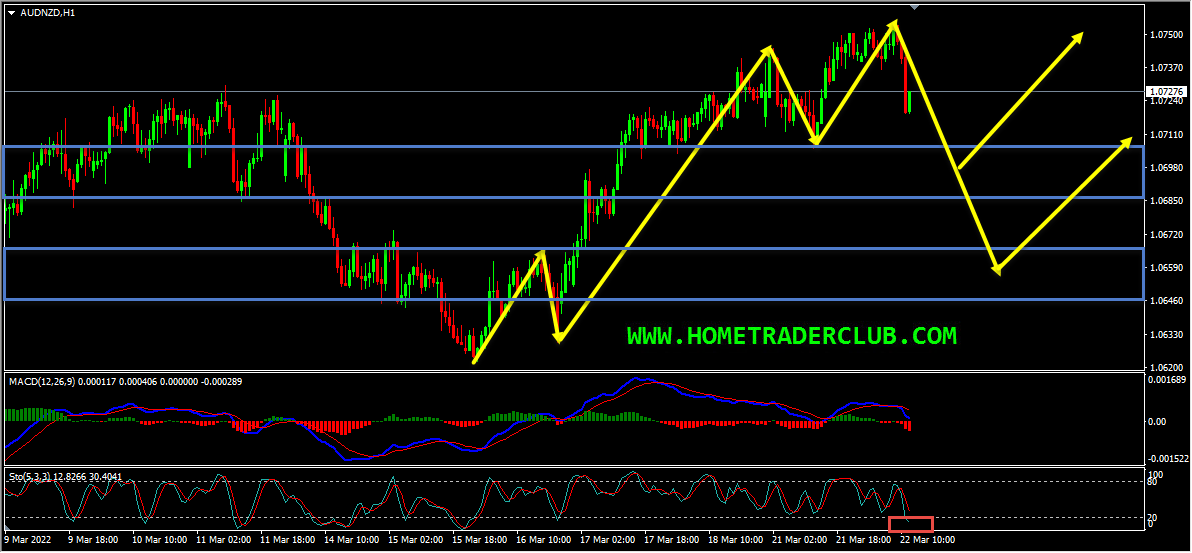
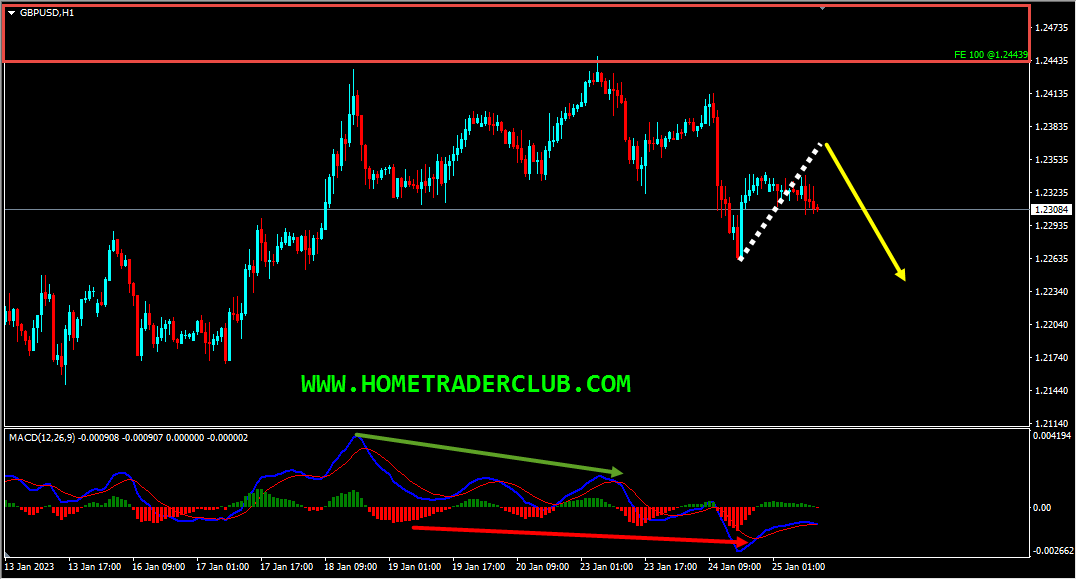
Bullish trend pattern and based on the stochastic oscillator the price has reached its extreme on the H1 chart.
Example 2
Key Resistance Zone based on the Fibonacci expansion levels of the two waves, bearish divergence based on the MACD indicator, the volumes are dropping based on the Volumes Indicator.
Bearish Divergence based on the MACD indicator and the ADX Indicator gave a bearish signal on the H4 chart.
Bearish divergence and lower lows based on the MACD indicator on the H1 chart.
Traders should consider the market context before using any indicator. For example, if the market is experiencing low volatility, it may not be the best time to use the Bollinger Bands, as they may not be as effective in identifying overbought or oversold conditions.
Whatever the indicator is, it is essential to remember that the indicator’s job is to indicate, and the price action is the one that dictates. Traders should look at price patterns and support and resistance levels in conjunction with technical indicators to better understand the market.
In our Home Trader Club, I do my technical analysis by combining indicators with Price Action; here are some examples:
Example 1
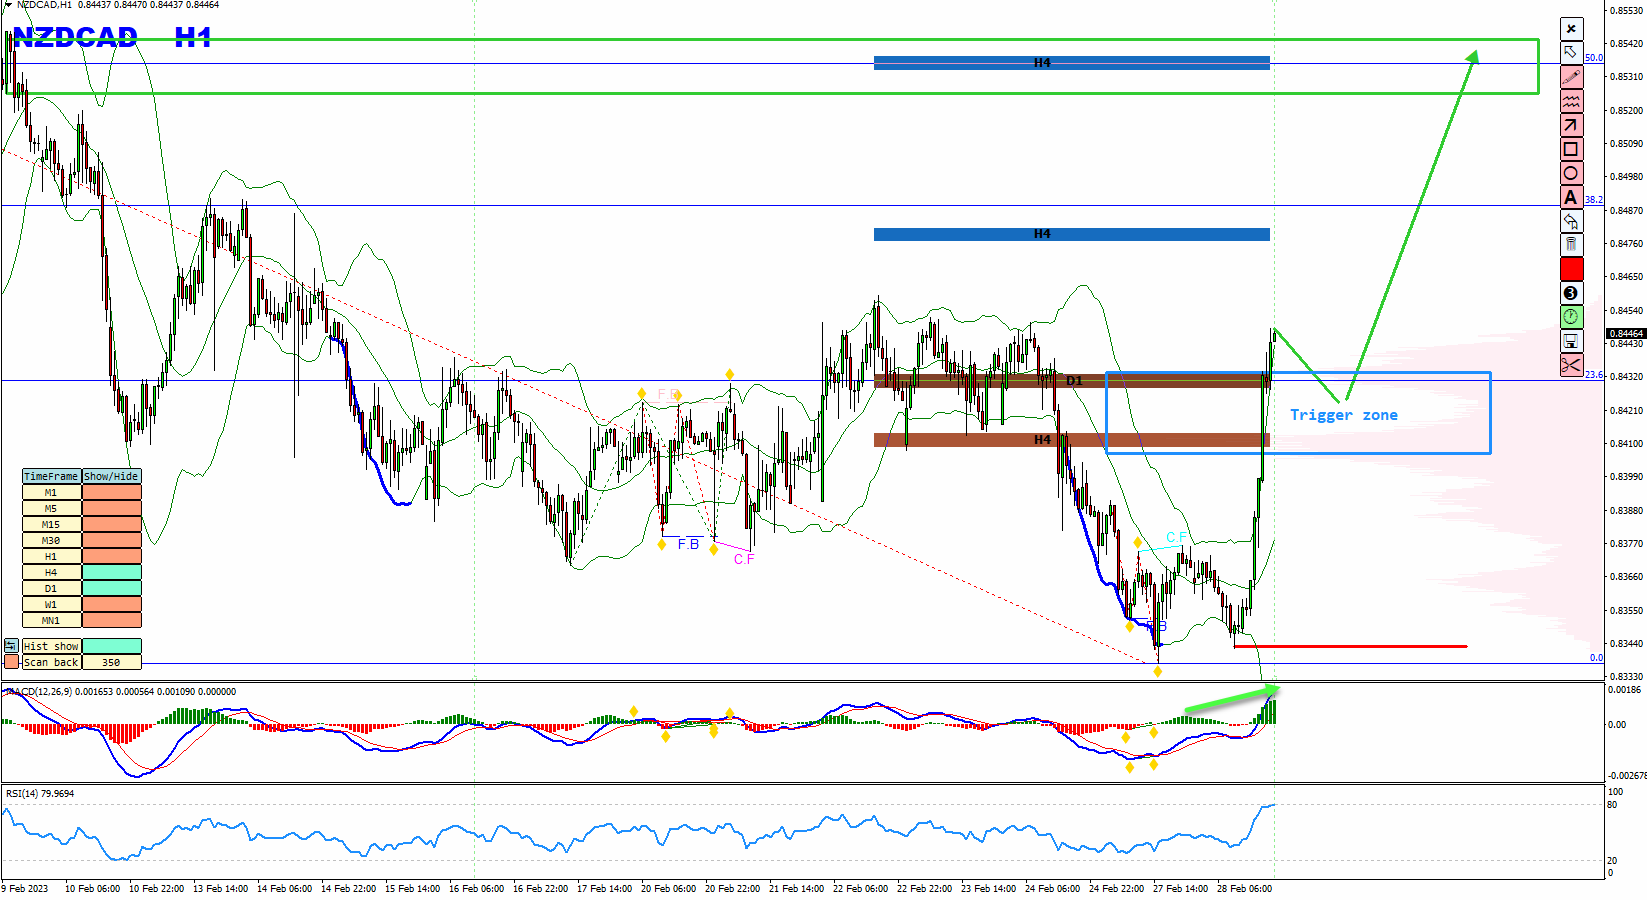
In this pair, the price reversed and showed a clear bullish momentum, whereas based on the KTLI (Key Trading Levels Indicator) the price broke above the strong resistance zones, which is a sign favouring the bulls. Also, we had higher highs based on the MACD indicator. Based on all this, I expected the price to move higher after pullbacks from the trigger zone shown in the chart below. Then as you can see in the second image, the price action followed my analysis and moved higher as per the plan!
You can get our Key Trading Levels Indicator here
Open
Close
Example 2
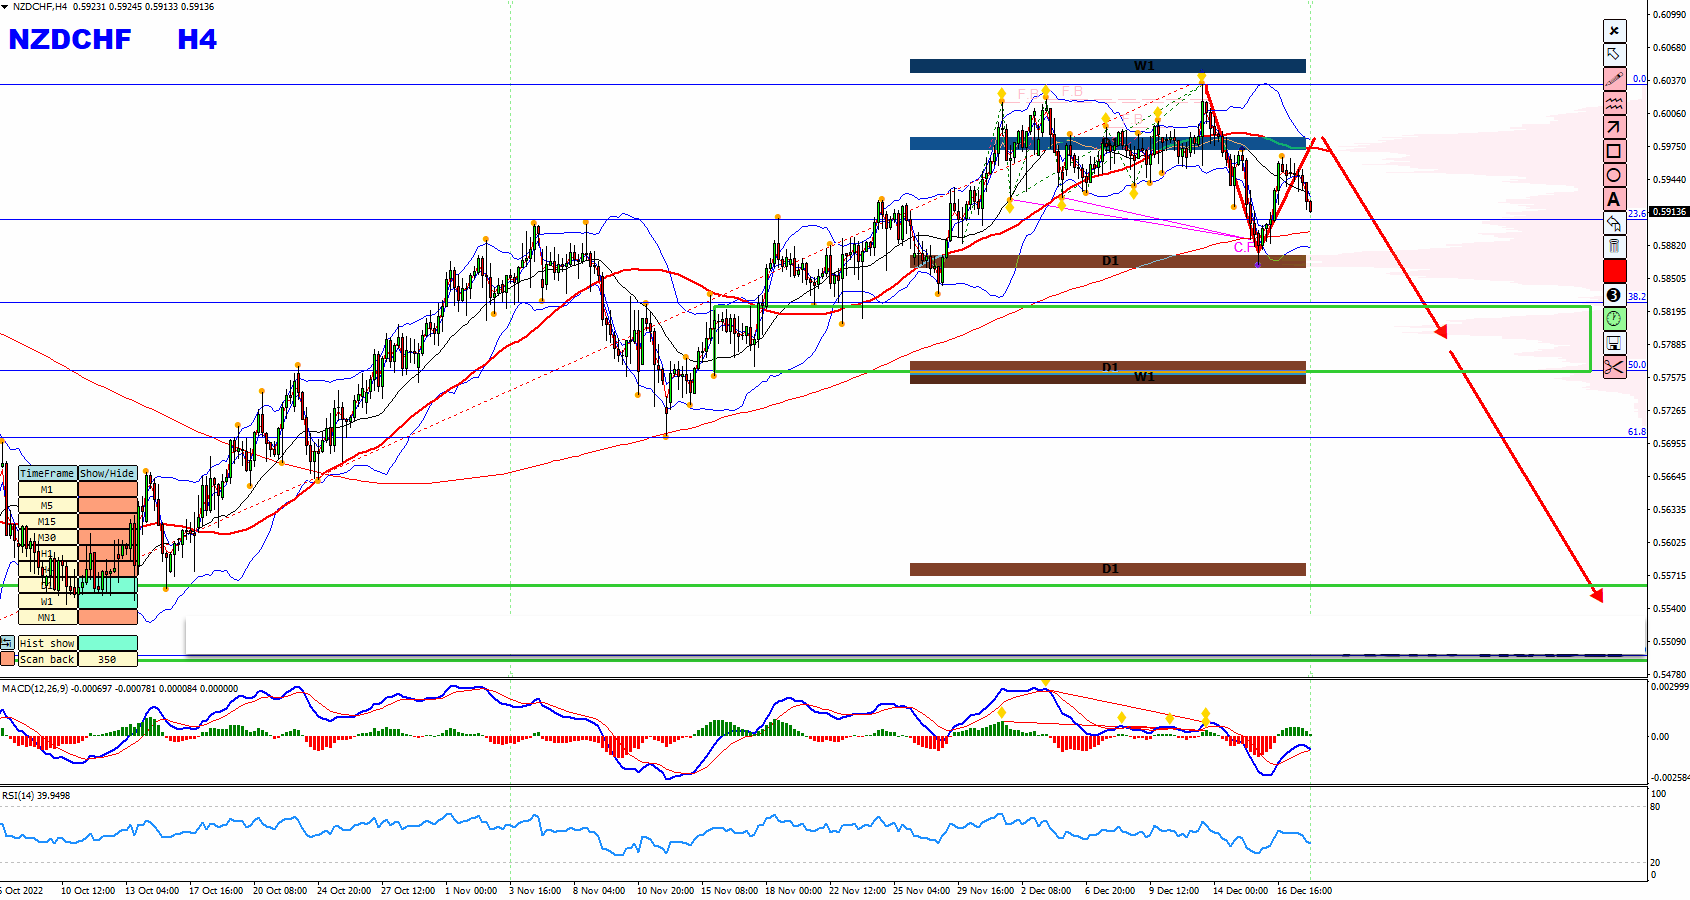
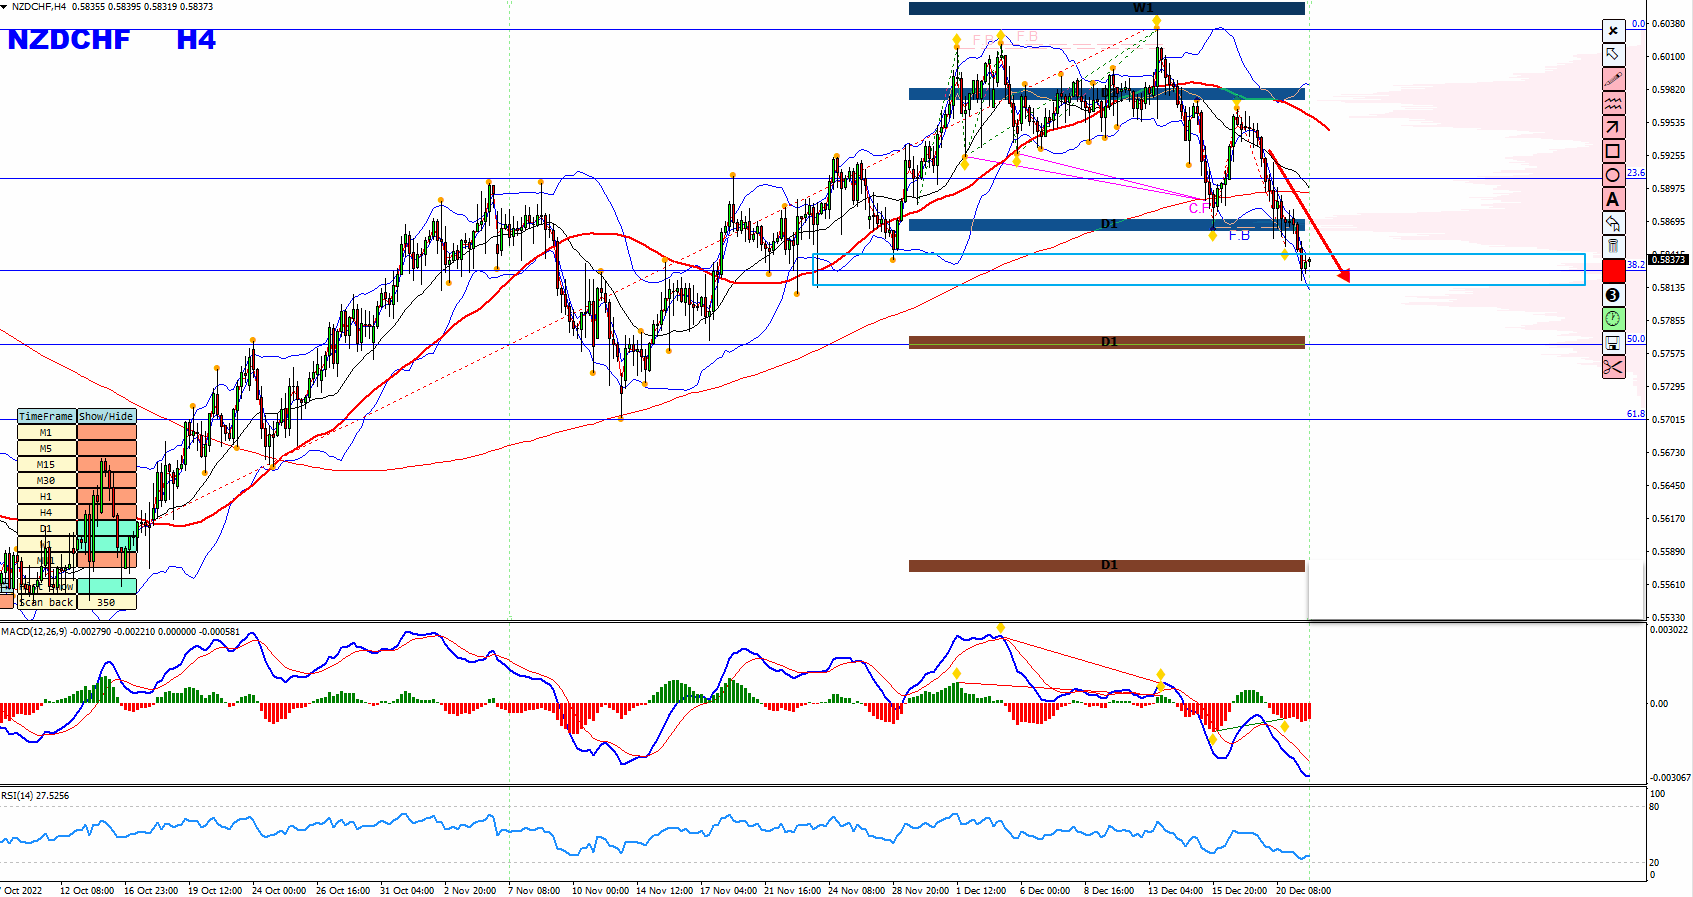
In this pair, based on the price action, we could see that the price created a series of higher highs and higher lows, made a turnaround and created lower lows for the first time in a while. Also, based on our False Break and Convergence indicator, we could see that the price has created a false break followed by a bearish convergence. In addition to this, based on the KTLI indicator, we could see that the price has broken below a strong support zone; we then had a pullback and the price respected this zone again and is moving lower. So based on all, I was expecting the price to move lower further. Then as you can see in the second image, the price action followed my analysis and moved lower as per the plan!
You can get our False Break And Convergence Indicator here
Open
Close
Traders should avoid over-reliance on technical indicators. Indicators are tools that help traders analyze the market and should not be the basis for making trading decisions. Traders should also consider other factors, such as price action, chart patterns, economic news and geopolitical events, that could impact the market.
On the whole, technical indicators can be useful tools in forex trading, but they should be used in conjunction with price action analysis and other market factors. Traders should understand their indicators, use multiple indicators in different timeframes, consider the market context, and avoid over-reliance on indicators. By using technical indicators effectively, traders can identify potential trading opportunities and make informed trading decisions. “Always keep in mind that the indicator’s job is to indicate, and the price action is the one that dictates”.
If you have any questions, don’t hesitate to drop a comment below!
Yours to your success,
Vladimir Ribakov
Internationally Certified Financial Technician
Hi Traders! Arvinth here from the Home Trader Club team. The weekly summary and, review of July…
The Japanese yen surged on Thursday, in a move analysts said bore the hallmarks of…
Hi Traders! EURAUD short term forecast and technical analysis is here. We do our analysis…
Hi Traders! NZDCAD short term forecast update and follow up is here. On June 2nd,…
Hi Traders! NZDCHF short term forecast and technical analysis is here. We do our analysis…
Hi Traders! AUDUSD short term forecast follow-up and update is here. On May 27th 2026…