Hi Traders! Oil short term forecast update and follow up is here. On October 15th I shared this “Oil Short Term Forecast And Technical Analysis” post in my blog. In this post, let’s do a recap of this setup and see how it has developed now. If you would like to learn more about the way we trade and the technical analysis we use then check out the Traders Academy Club. Spoiler alert – free memberships are available!
My Idea
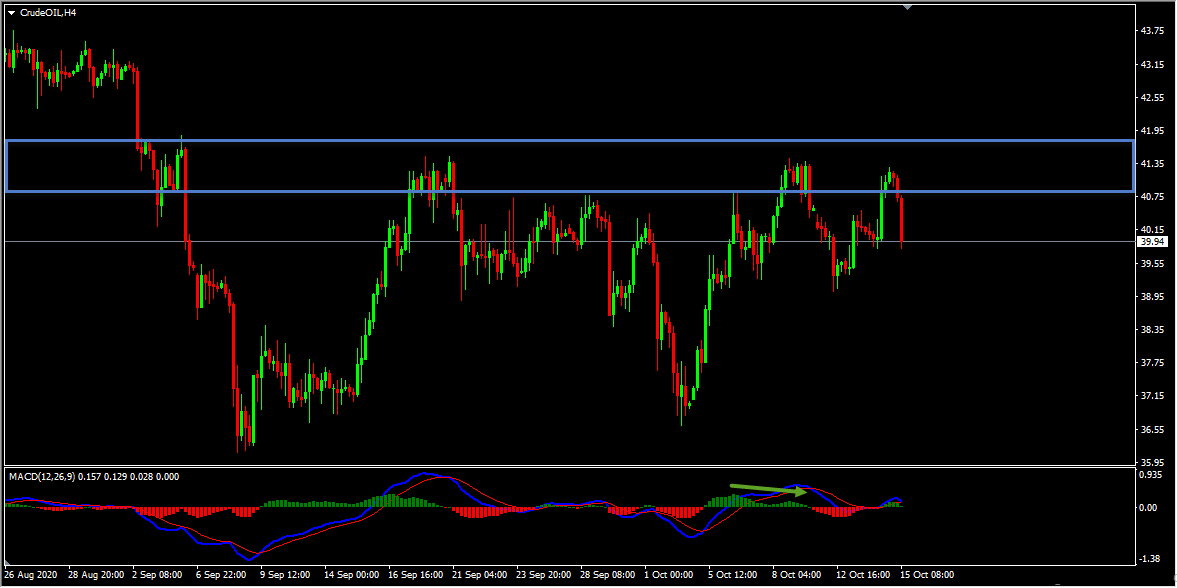
On the H4 chart, we have a strong resistance zone that has formed and the price which is moving higher has reached this strong resistance zone, respected it, and is currently moving lower. We also had a continuing bearish divergence between the first high that has formed on 6th October 2020 and the second high that has formed on 8th October 2020 based on the histogram of the MACD indicator which we may consider as evidence of bearish pressure. In addition to this currently, there are no evidences contradicting this bearish view.
On the H4 chart the price pushed higher again and reached the key resistance zone, respected it and bounced lower from this zone. The market provided with various facts supporting the bearish view here in the form of a false break with bearish divergence between the first high that has formed at 41.45 and the second high that has formed at 41.87 based on the moving averages of the MACD indicator. Then the price which was moving lower broke below the most recent uptrend line and retested it which we may consider as another fact provided by the market supporting the bearish view. The price then moved lower further as I expected it to and provided an amazing move to the downside.
(Note: You can learn about a Killer Forex Strategy “Double Trend Line Principle” here)
This is a good example of how the market provided us with hints supporting the bearish view. As you can see in the example above the market provided us with hints in the form of a false break with bearish divergence, and the most recent uptrend line breakout which acted as evidences of bearish pressure. Also, there were no contradictory signs and the key resistance zone was holding. Then as you can see in the screenshot above how the price moved lower after that. This is why I always say that as traders we should follow the facts and hints that the market provides us and take the right action.
For similar trade ideas and much more join the Traders Academy Club and get access to our complete watch list and trade report.
This is how the report looks like. A table with the hottest market opportunities, screenshot behind every pair and time frame (anything that is in blue inside the table is clickable and leads to a screenshot) + a summary in text format, kind of highlights. And of course, Live Market Analysis every single day.
If you have any further questions, don’t hesitate to drop a comment below!
To your success,
Vladimir Ribakov
Certified Financial Technician
Hi Traders! USDCHF short term forecast update and follow up is here. On May 20th,…
Hi Traders! CADCHF short term forecast and technical analysis is here. We do our analysis…
The dollar was broadly steady on Monday as cautious investors watched out for signals on…
Hi Traders! Arvinth here from the Home Trader Club team. The weekly summary and, review of July…
European markets edged lower on Thursday following more overnight volatility in Asia’s tech-dominated indexes, while…
Hi Traders! EURGBP short term forecast and technical analysis is here. We do our analysis…