Hi Traders! Ripple short term forecast update and follow up is here. On September 2nd I shared this “Ripple Short Term Forecast And Technical Analysis” post in our blog. In this post, let’s do a recap of this setup and see how it has developed now. If you would like to learn more about the way we trade and the technical analysis we use then check out the Traders Academy Club. Spoiler alert – free memberships are available!
My Idea
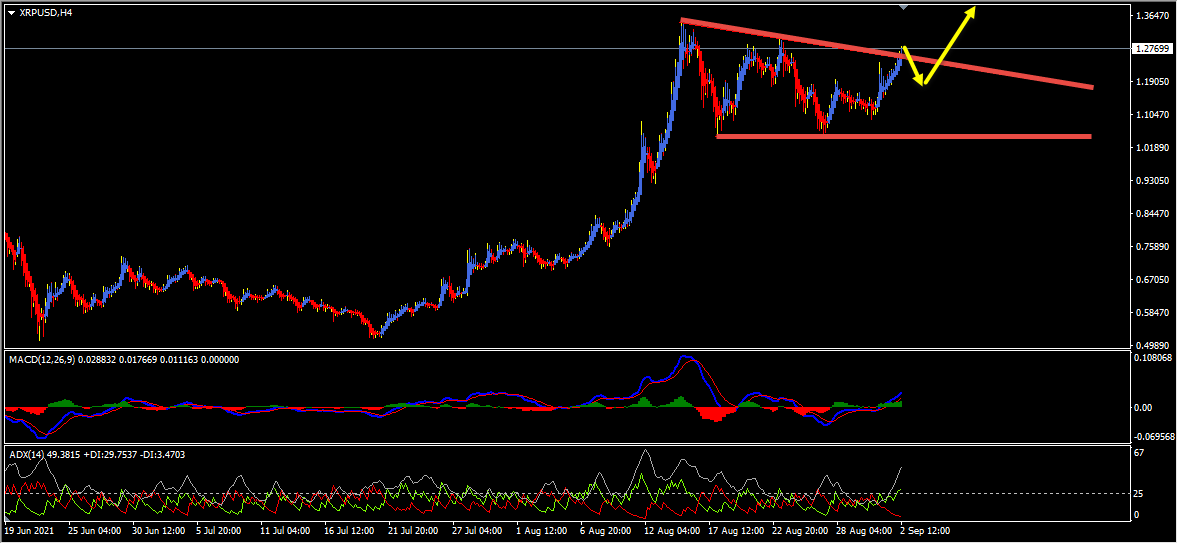
On the H4 chart too, based on the Heikin Ashi candles we can see that currently, we have strong bullish bodies in upward moving market conditions so it basically reflects a bullish environment here as well. After the strong bullish move, we had a correction in the form of a range here and the price which was respecting this range so far has currently broken above the top of it and is holding above it. In addition to this, the ADX indicator gave a bullish signal here at the cross of +DI (green line) versus -DI (red line) and the main signal line (silver line) reads value over 25. We may consider these as evidences of bullish pressure and also there are no signs opposing this bullish view, here as well. So based on all this my view here is bullish and I expect the price to move higher further until the bottom of this range holds.
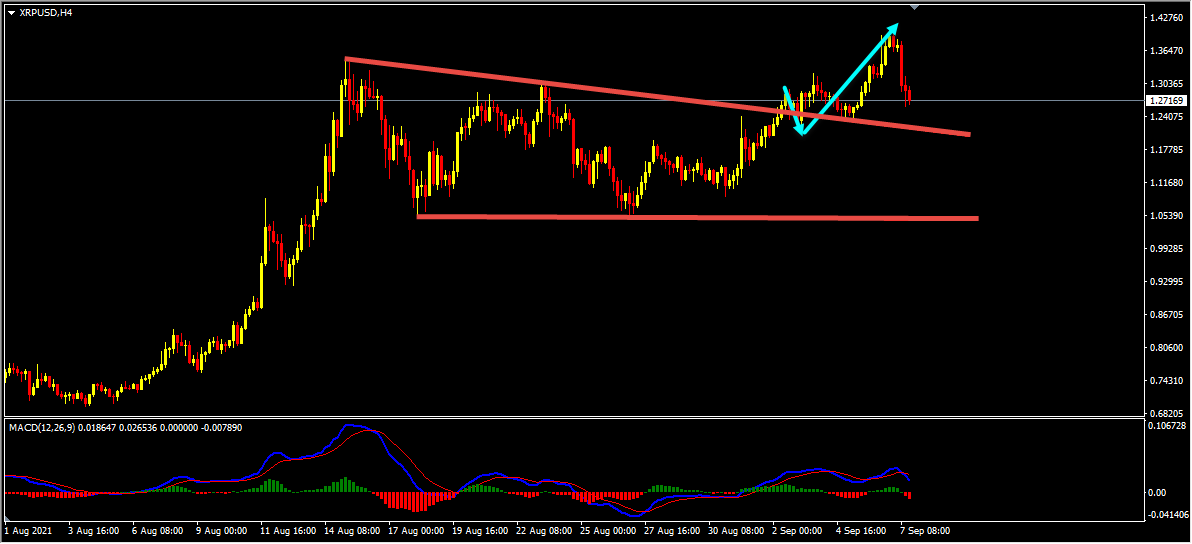
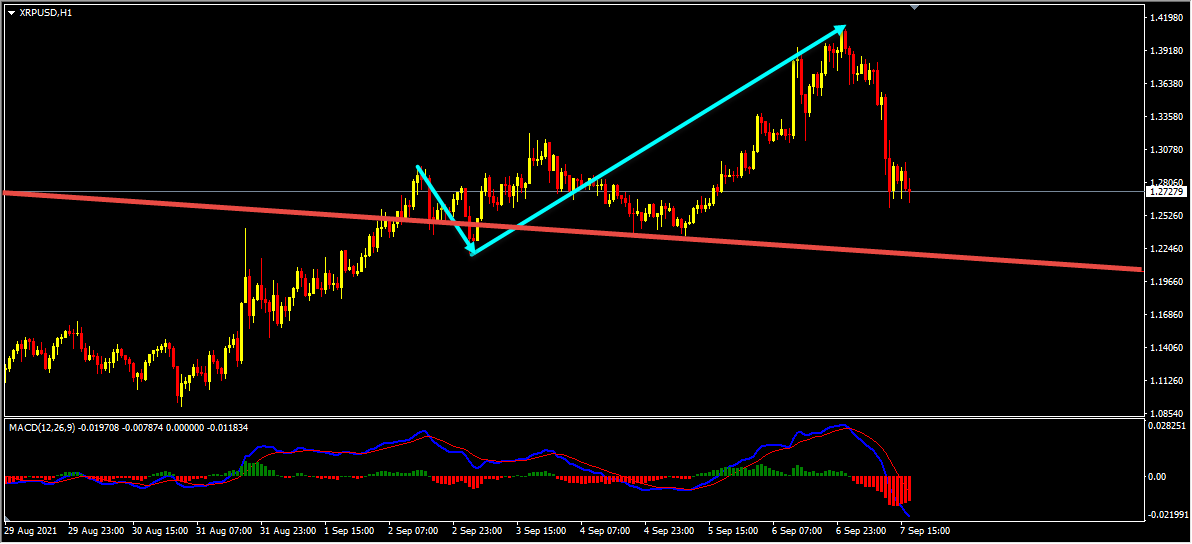
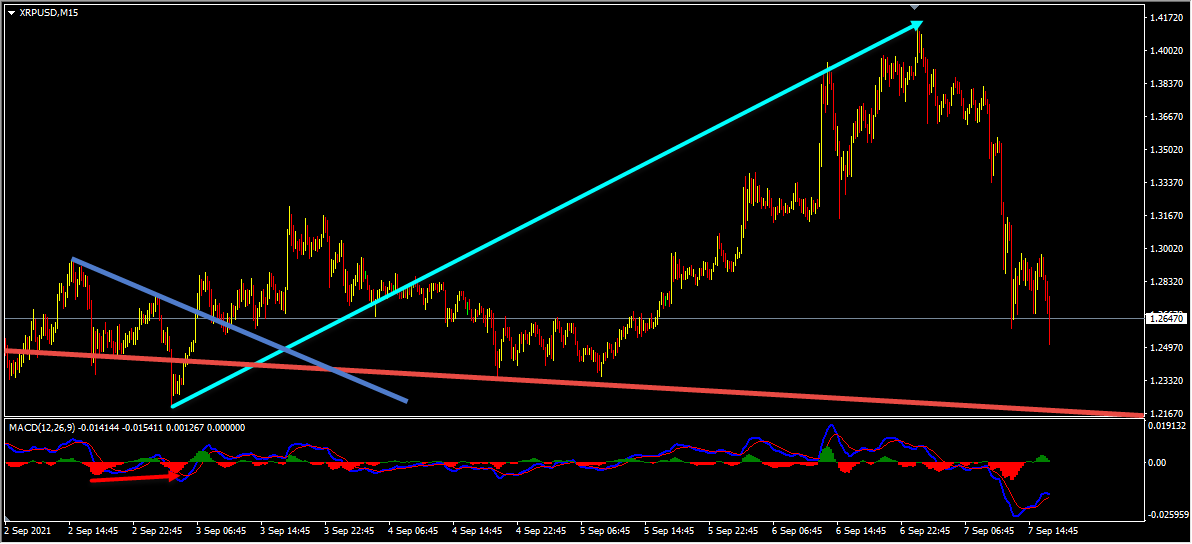
In Ripple my short term view was bullish and I was expecting the price to move higher further until the bottom of the range holds. The price action followed my analysis here exactly as I expected it to. After the breakout above the top of the range, we had a pullback with the price retesting this breakout. The price then moved higher further as I expected it to and provided a nice move to the upside.
(Note: You can learn about a Killer Forex Strategy “Double Trend Line Principle” here)
For similar trade ideas and much more I invite you to
Also, you can get one of our strategies free of charge. You will find all the details here
If you have any further questions, don’t hesitate to drop a comment below!
Happy Trading!
Yordan Kuzmanov
Chief Trader at the Traders Academy Club
Hi Traders! Arvinth here from the Home Trader Club team. The weekly summary and, review of July…
The Japanese yen surged on Thursday, in a move analysts said bore the hallmarks of…
Hi Traders! EURAUD short term forecast and technical analysis is here. We do our analysis…
Hi Traders! NZDCAD short term forecast update and follow up is here. On June 2nd,…
Hi Traders! NZDCHF short term forecast and technical analysis is here. We do our analysis…
Hi Traders! AUDUSD short term forecast follow-up and update is here. On May 27th 2026…