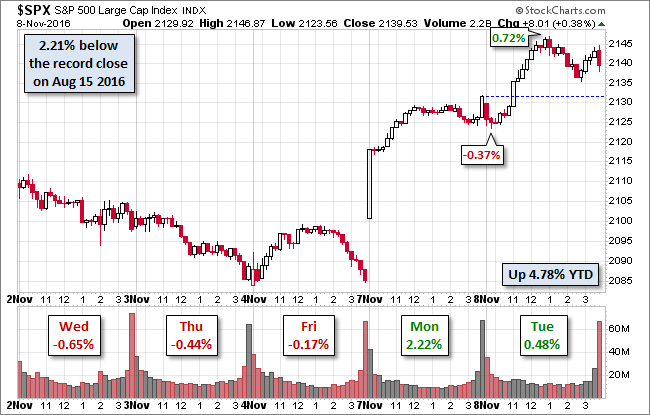
The Monday rally snapping a nine-day selloff in S&P 500, the longest selloff in nearly 36 years, continued Tuesday in a more subdued mode. The index opened lower, hitting its -0.37% intraday low in the first 30 minutes of the session and then rose steadily to its 0.72% midday high.
It then zigzagged during the afternoon and closed with a modest 0.38% gain. In two days the S&P 500 has erased about 85% of the nine-day selloff. All eyes are now on the behavior of the markets when the election results are revealed.
The 10-year Note closed the session at 1.88%, up five BPs from the previous close.
Here is a snapshot of the past five sessions.
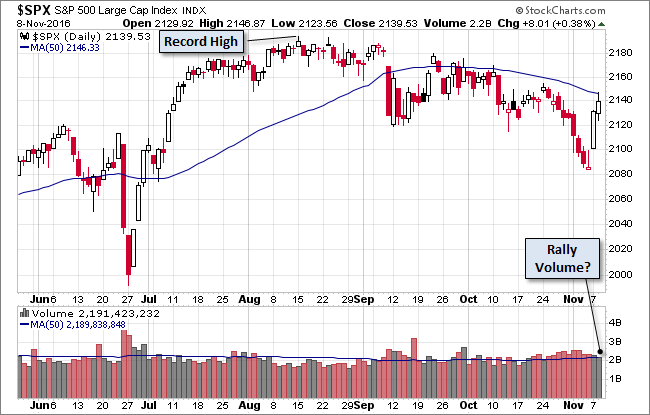
Here’s a daily chart of the index. Rally volume remains unimpressive. Note that the 50-day moving average was an apparent point of resistance for Tuesday’s trade.
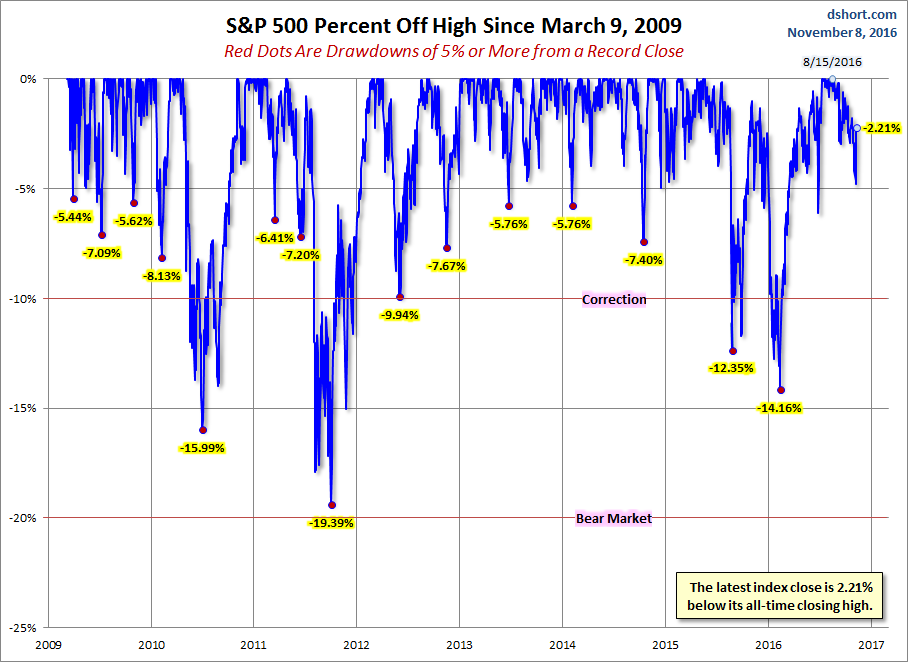
Here’s a snapshot of selloffs since the 2009 trough.
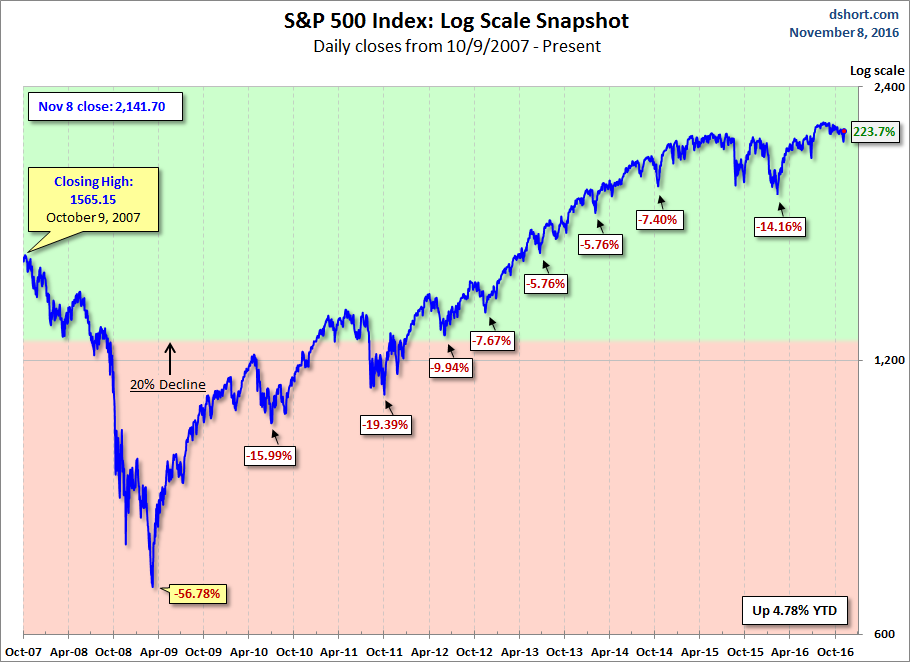
Here is a more conventional log-scale chart with drawdowns highlighted.
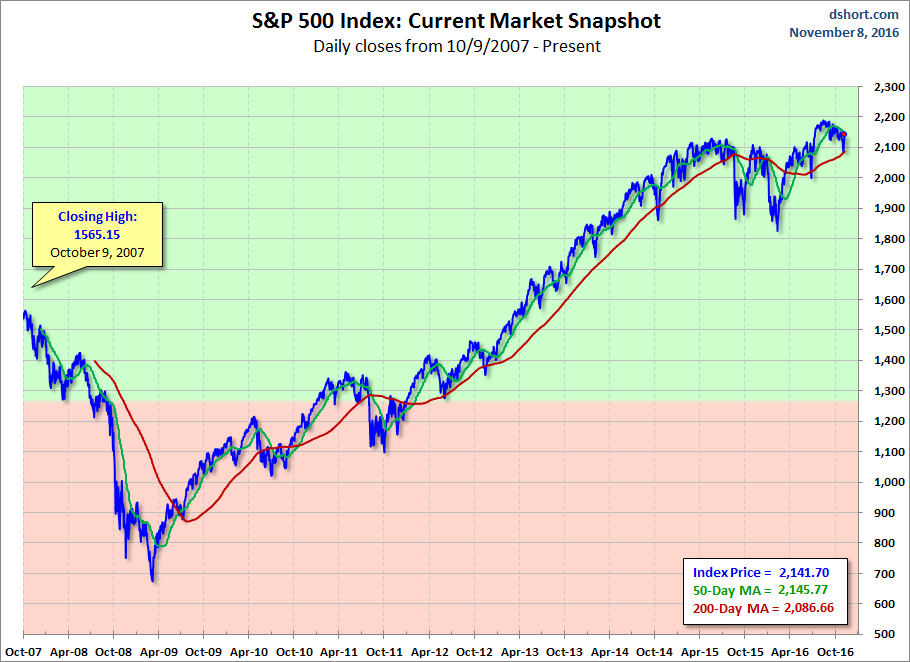
Here is a linear scale version of the same chart with the 50- and 200-day moving averages.
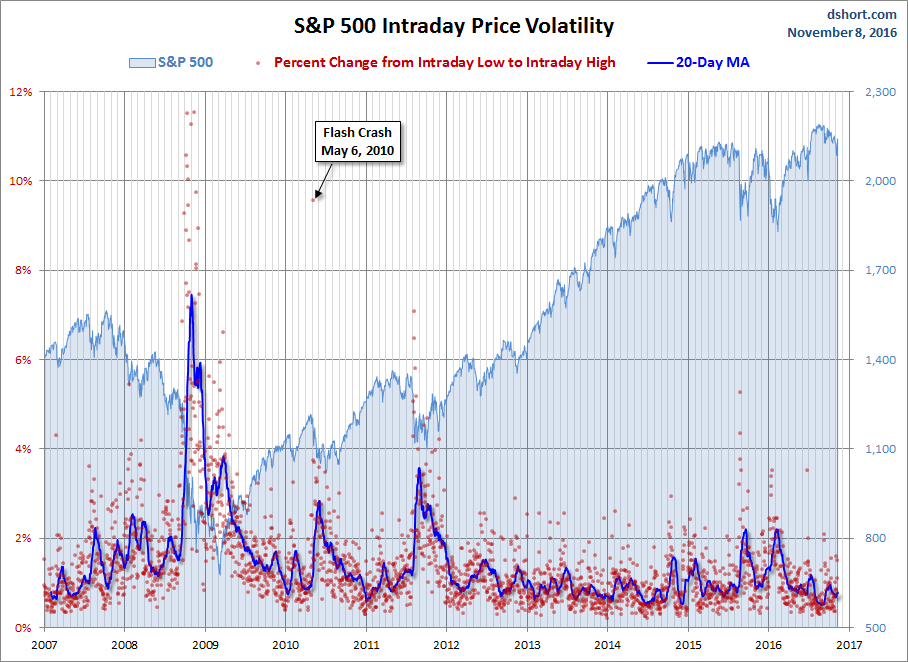
For a sense of the correlation between the closing price and intraday volatility, the chart below overlays the S&P 500 since 2007 with the intraday price range. We’ve also included a 20-day moving average to help identify trends in volatility.
GDP growth is one of the most important indicators of economic health. But does stronger…
When it comes to fundamental Forex analysis, few institutions matter as much as the Federal…
Interest rates are one of the most important fundamental forces in the Forex market. But…
The latest U.S. employment report has delivered a significant warning for the market. With only…
The Forex market does not always offer clear trading opportunities. Sometimes, price moves sharply in…
Open social media for a few minutes and you can easily find someone talking about…
View Comments
You are welcome guys
Thank you so much for sharing it
Lucky to have a mentor like you.
Very useful info, thank you.
Thanks for the analysis Vlad