Hi Traders! US Dollar Index short term forecast update and follow up is here. On February 9th 2022 I shared this “US Dollar Index Technical Analysis And Short Term Forecast” post in our blog. In this post, let’s do a recap of this setup and see how it has developed now. If you would like to learn more about the way we trade and the technical analysis we use then check out the Home Trader Club. Spoiler alert – free memberships are available!
My Idea
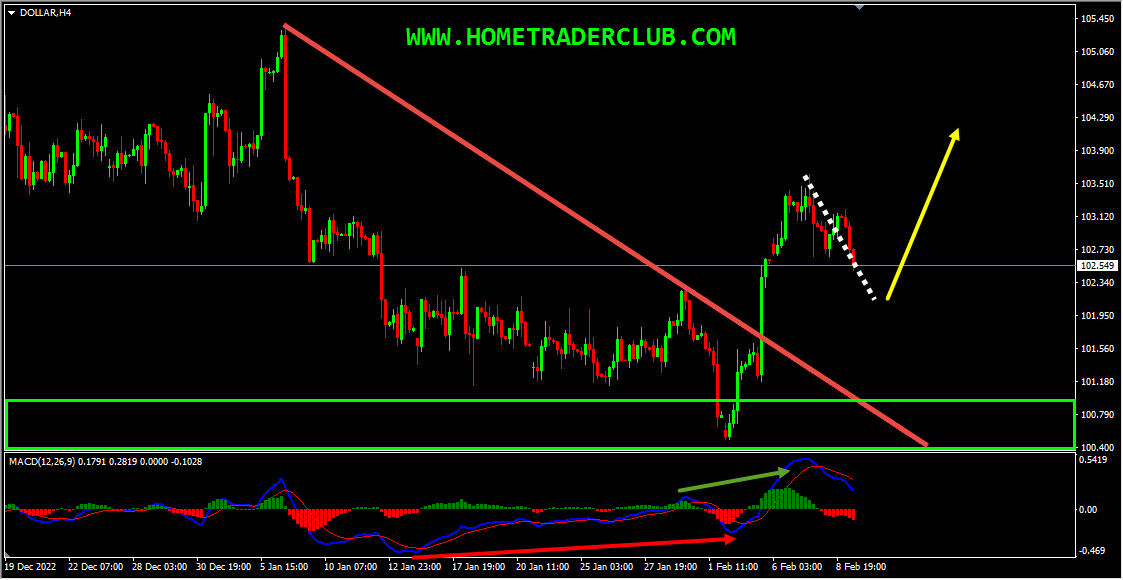
On the H4 chart, the price which was moving lower reached a strong support zone, respected it and bounced higher from this zone. Also, we had a bullish divergence that has formed between the first low that has formed at 101.377 and the second low that has formed at 100.492 based on the MACD indicator which we may consider as evidence of bullish pressure. The price then moved higher and broke above the high at 102.253 thus creating higher highs. Also, the price has broken above the most recent downtrend line and is currently holding above it, we may consider these as other evidence of bullish pressure. So based on all this, my short-term view remains bullish here and I expect the price to move higher further after pullbacks until the strong support zone (marked in green) shown in the image below holds.
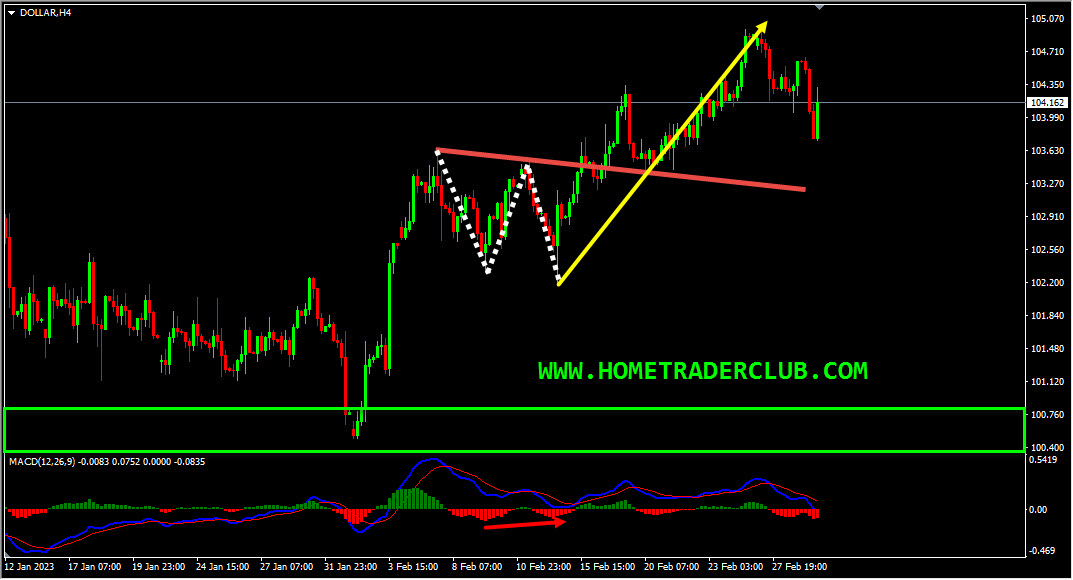
On the H4 chart, based on the above-mentioned analysis my short-term view was bullish here and I was expecting the price to move higher further after pullbacks. The price moved exactly as I expected it to here. After the higher highs, we had a classical correction in the form of a double wave down with the price creating a bullish divergence between the two waves. The price then moved higher and broke above the most recent downtrend line, we may consider these as facts provided by the market supporting the bullish view. The price then moved higher further as I expected it to and delivered 280+ pips move to the upside as you can see in the image below.
(Note: You can learn about a Killer Forex Strategy “Double Trend Line Principle” here)
As traders we always have two choices, the first one is to fall in love with our analysis and try to convince the market and expect the price to move in the direction per our wish. The second one is to follow the facts that the market provides us and make the right actions according to that. As you know the first option won’t help us and as you can see in the example above what happened when we followed the facts that the market hinted to us and took the right action according to that.
Not sure how to enter a trade? Spot reversals (bounces)? Not sure how to spot breakouts?
I invite you to
And improve your trading with us.
Also, you can get one of our strategies free of charge. You will find all the details here
Download our best forex indicators here
If you have any further questions, don’t hesitate to drop a comment below!
Happy Trading!
Arvinth Akash
Home Trader Club Team.
Hi Traders! USDCHF short term forecast update and follow up is here. On May 20th,…
Hi Traders! CADCHF short term forecast and technical analysis is here. We do our analysis…
The dollar was broadly steady on Monday as cautious investors watched out for signals on…
Hi Traders! Arvinth here from the Home Trader Club team. The weekly summary and, review of July…
European markets edged lower on Thursday following more overnight volatility in Asia’s tech-dominated indexes, while…
Hi Traders! EURGBP short term forecast and technical analysis is here. We do our analysis…