Hi Traders! Weekly Summary And Review April 23rd, 2021 is here. It is now time to recap and summarize the trade setups that we had during this week. Below you will find the short explanation of all the trade setups we had in this week and how it has currently developed now.
First, we will see the trade ideas that I shared in my blog:
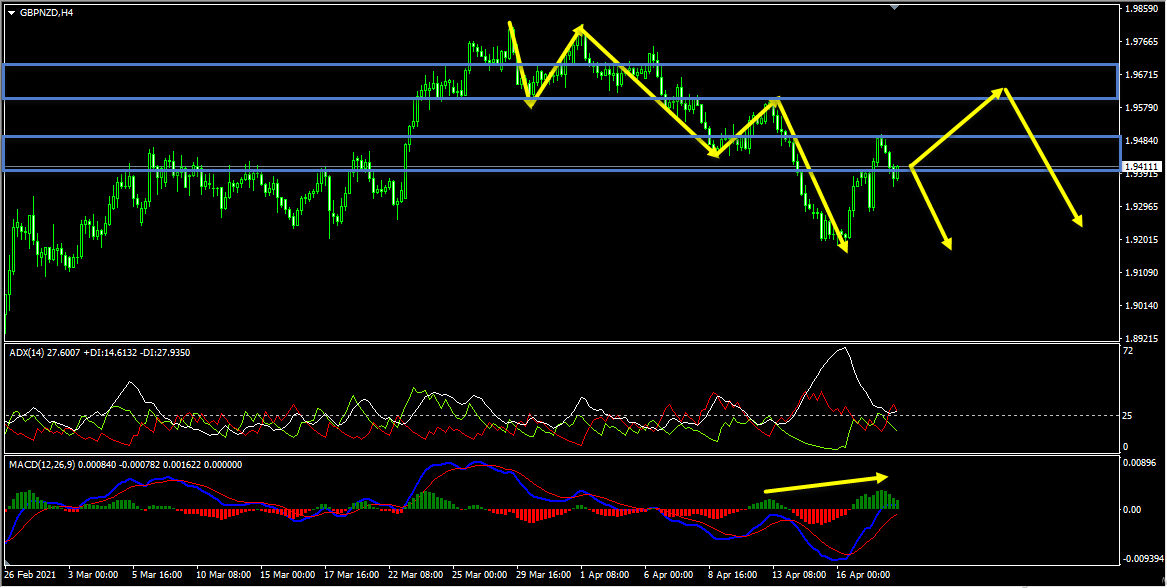
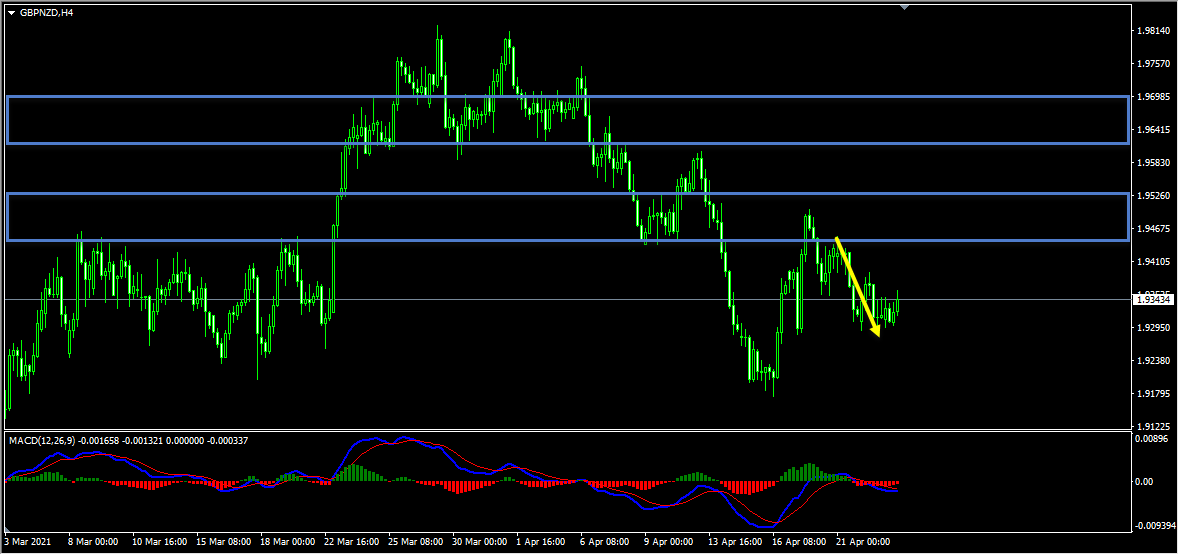
GBPNZD – My idea here was “On the H4 chart, the price which is moving lower has created a bearish trend pattern in the form of three lower highs, lower lows which we may consider as evidence of bearish pressure. Generally, after a bearish trend pattern, we may expect corrections and then further continuation lower. Currently it looks like a correction is happening and the price which is moving higher has created a bearish hidden divergence that has formed between the first high that has formed on 13th April 2021 and the second high that has formed on 19th April 2021 based on the MACD indicator which we may consider as another evidence of bearish pressure. In addition to this, the ADX indicator gave a bearish signal here at the cross of -DI (red line) versus +DI (green line) and the main signal line (silver line) reads value over 25 which we may consider as yet another evidence of bearish pressure. We also have two strong resistance zones that has formed and the price which is moving higher has reached the first resistance zone, respected it and is currently moving lower. There are two possible scenarios from here, the price might move lower from the current zone or alternatively if the price moves higher then the next area to look for bearish setups with bearish evidences would be the second resistance zone”.
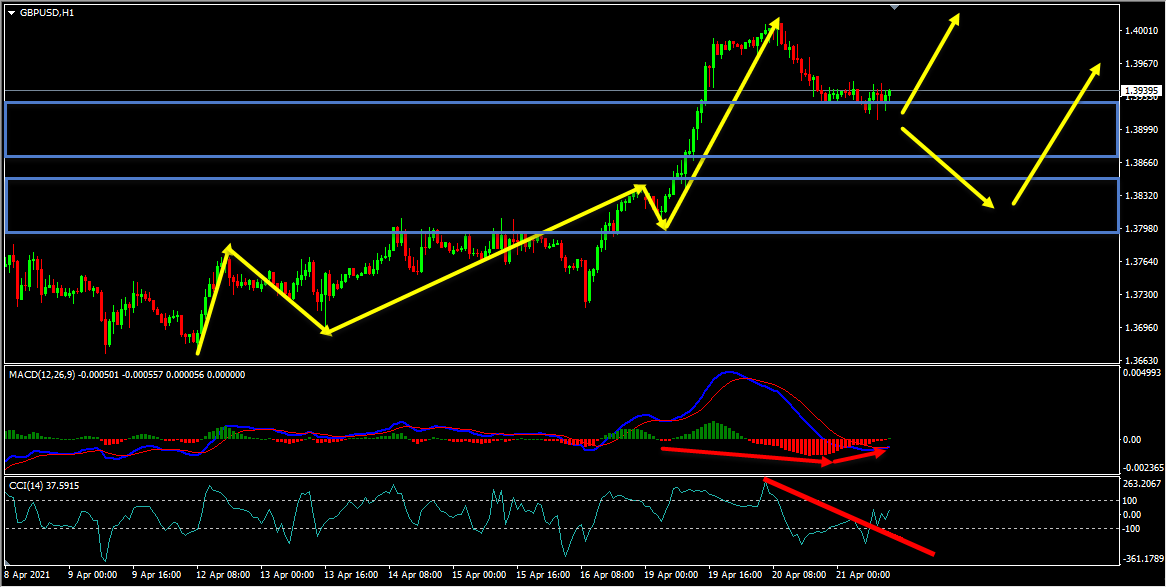
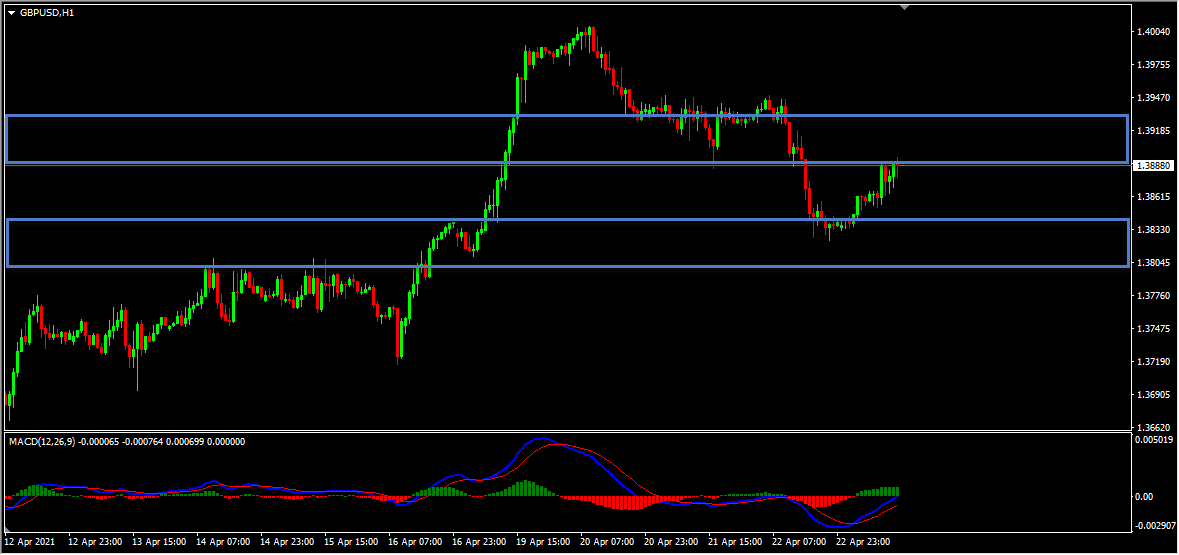
GBPUSD – My idea here was “On the H1 chart the price which was moving higher has created a bullish trend pattern in the form of three higher highs, higher lows, we may consider this as evidence of bullish pressure. Generally, after a bullish trend pattern, we may expect corrections and then potential continuation higher. Currently, it looks like a correction is happening and the price which is moving lower has reached a strong support zone. We also have a bullish hidden divergence that has formed between the first low that has formed at 1.38094 and the second low that has formed at 1.39259 based on the MACD indicator followed by a continuing bullish divergence. Also we have a downtrend line breakout based on the CCI indicator. We may consider these as evidences of bullish pressure. There are two possible scenarios from here, the price might move higher from the current zone or alternatively if it moves lower then the next area to look for bullish setups with bullish evidences would be the second strong support zone”.
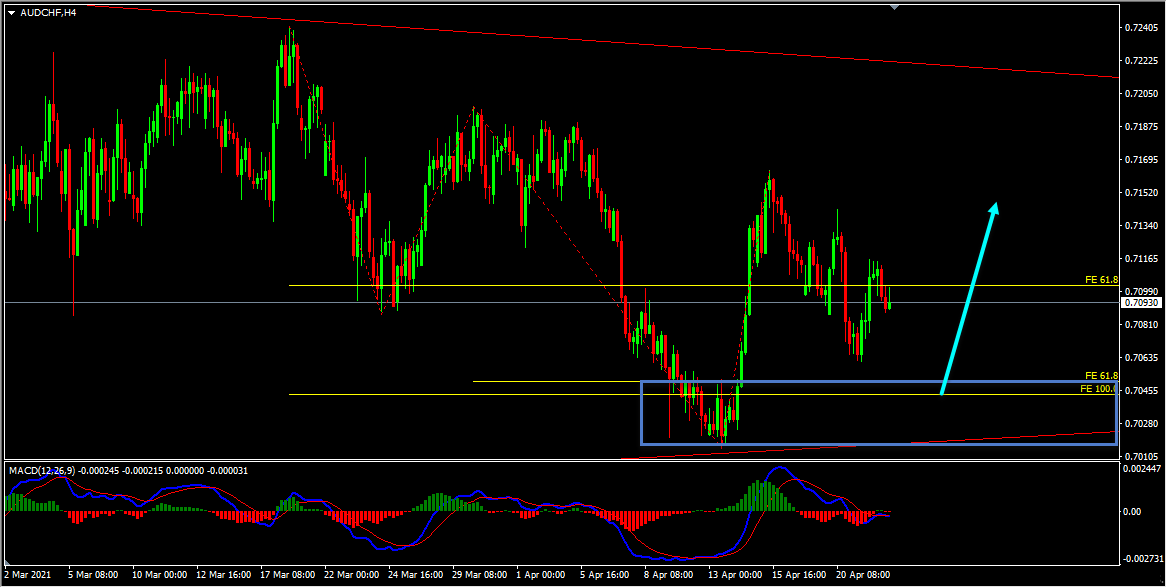
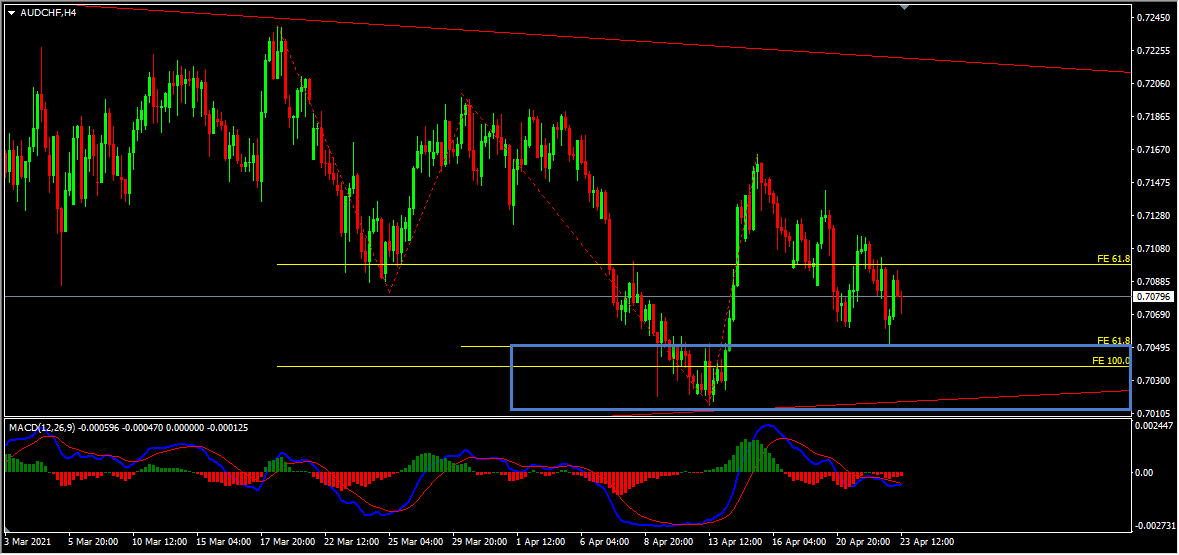
AUDCHF – My idea here was “On the H4 chart we have a key support zone that has formed based on the 100% Fibonacci expansion level of the first wave, 61.8% Fibonacci expansion level of the second wave and the bottom of the range. The price which was moving lower reached this zone, respected it and is bouncing higher from this zone. Currently it looks like a pullback is happening and there are no signs opposing this bullish view. So based on all this my view here is bullish and I expect the price to move higher further until this key support zone holds”.
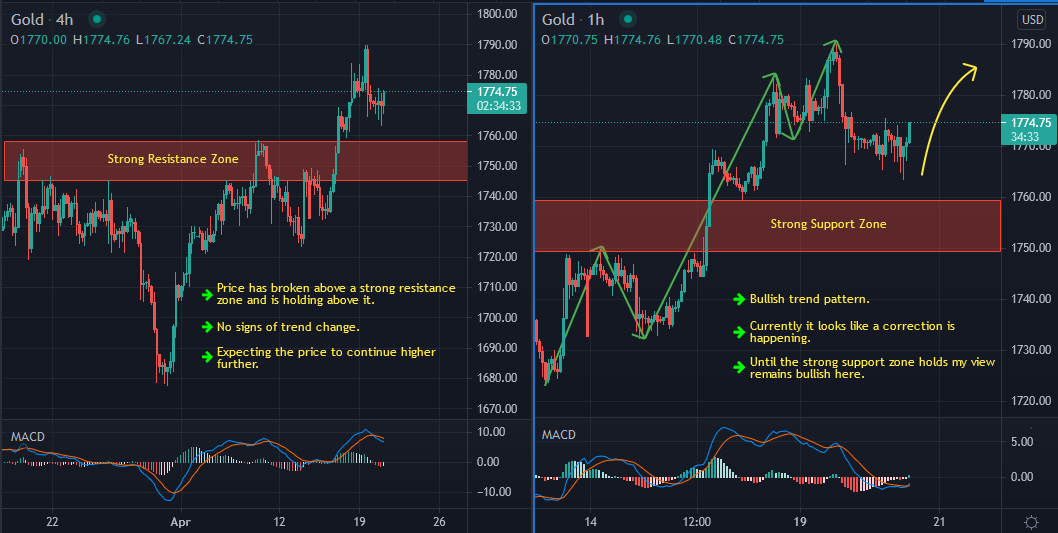
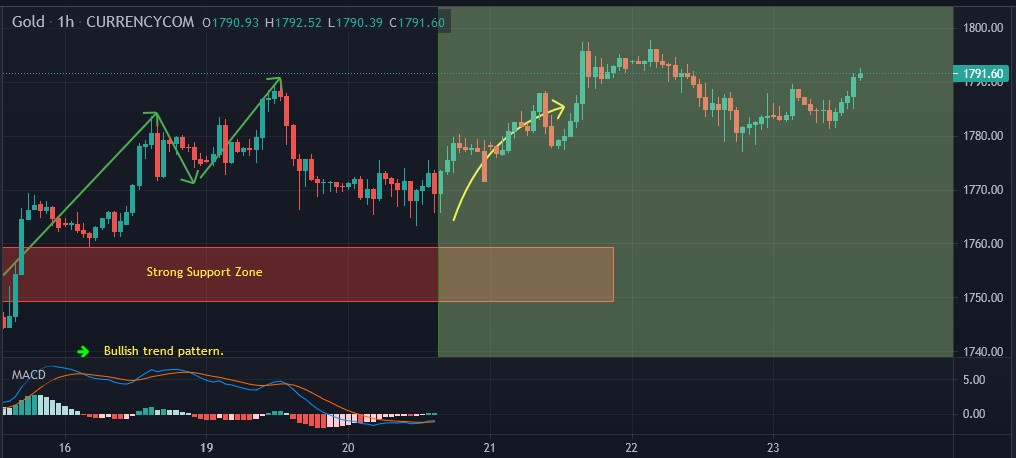
Gold – My idea here was as follows:
Current Scenario – The price action followed my analysis exactly as I expected it to here. After the bullish trend pattern we had a pullback but the price was holding above the strong support zone. The price then moved higher further and provided an excellent move to the upside.
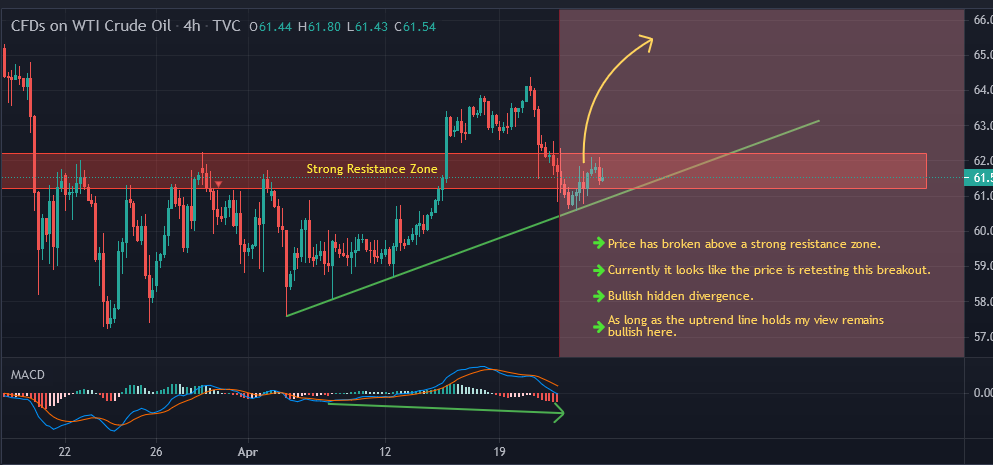
Oil – My idea here was as follows:
Current Scenario – In Oil my view was bullish and I was expecting the price to move higher further until the uptrend line holds. My plan still remains the same here.
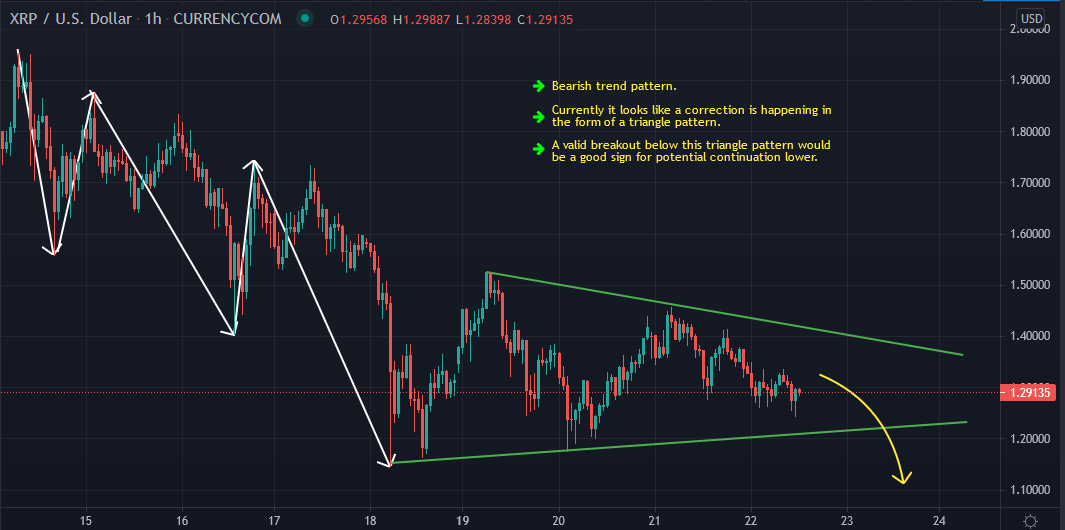
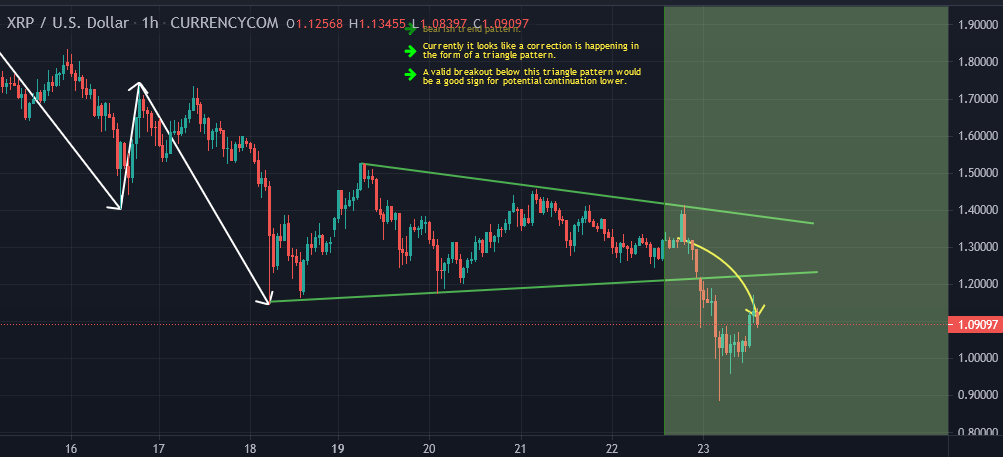
Ripple – My idea here was as follows:
Current Scenario – The validation for the bearish view which is a valid breakout below the triangle pattern happened as I expected it to. The price then moved lower further and provided a nice move to the downside so far.
Note: You can follow me here on Trading View and also on my blog to get similar ideas on daily basis)
For similar trade ideas and much more join the Traders Academy Club and get access to our complete watch list and trade report.
This is how the report looks like. A table with the hottest market opportunities, screenshot behind every pair and time frame (anything that is in blue inside the table is clickable and leads to a screenshot) + a summary in text format, kind of highlights. And of course Live Market Analysis every single day.
If you have any further questions, don’t hesitate to drop a comment below!
To your success,
Vladimir Ribakov
Certified Financial Technician
Hi Traders! USDCHF short term forecast update and follow up is here. On May 20th,…
Hi Traders! CADCHF short term forecast and technical analysis is here. We do our analysis…
The dollar was broadly steady on Monday as cautious investors watched out for signals on…
Hi Traders! Arvinth here from the Home Trader Club team. The weekly summary and, review of July…
European markets edged lower on Thursday following more overnight volatility in Asia’s tech-dominated indexes, while…
Hi Traders! EURGBP short term forecast and technical analysis is here. We do our analysis…
View Comments
Thanks alot