Hi Traders! Arvinth here from Traders Academy Club team. Weekly summary and review June 24th 2022 is here. It is now time to recap and summarize the trade setups that we had during this week. Below you will find the short explanation of all the trade setups we had this week and how it has currently developed now.
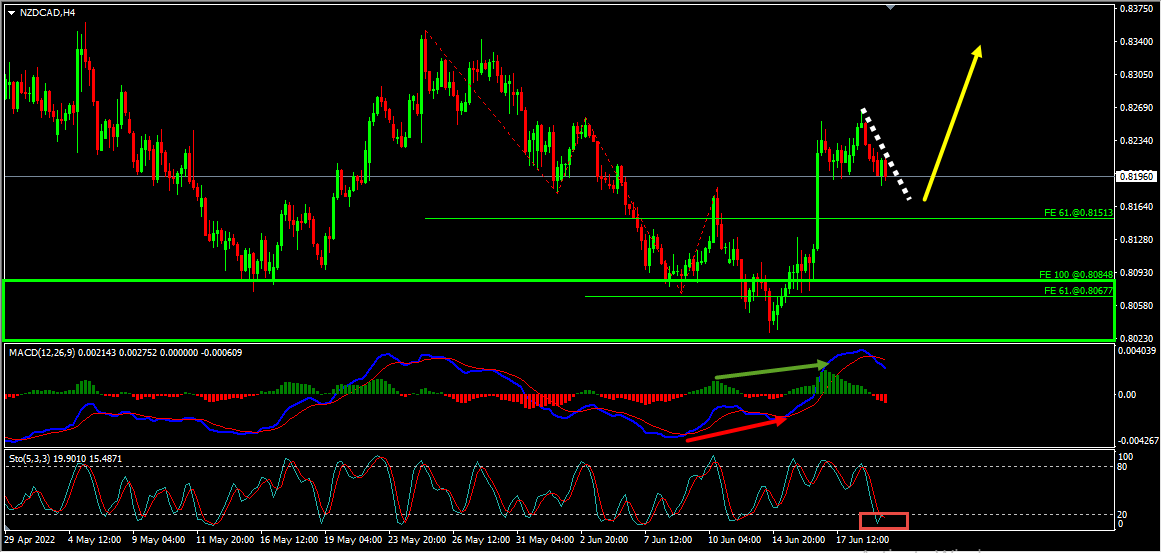
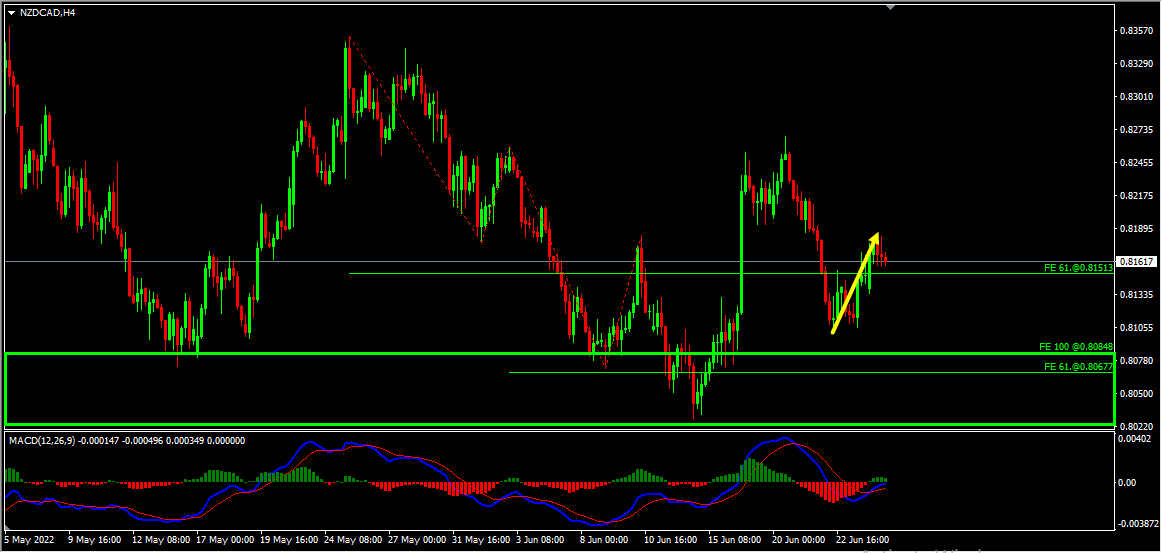
NZDCAD – My idea here was “On the H4 chart, the price which was moving lower reached a key support zone that has formed based on the 100%(0.80848) Fibonacci expansion level of the first wave and the 61.8%(0.80677) Fibonacci expansion level of the second wave. The price respected this key support zone and bounced higher from this zone. In addition to this, we could see that the price which was moving lower created a bullish divergence that has formed between the first low that has formed at 0.80740 and the second low that has formed at 0.80289 based on the MACD indicator. The price then moved higher and broke above the last high at 0.81840 creating higher highs, thus forming a classical setup of bullish divergence followed by bullish convergence. Hence as per the book scenario, after a bullish convergence, we may look for corrections to happen and then further continuation to the upside. Currently, it looks like a correction is happening. Also, based on the Stochastic Oscillator we could see that the price has reached its extreme which we may consider as yet another evidence favoring this short term bullish view. So based on all this, until the key support zone shown in the image below (marked in green) holds my short term view remains bullish here and I expect the price to move higher further after pullbacks”.
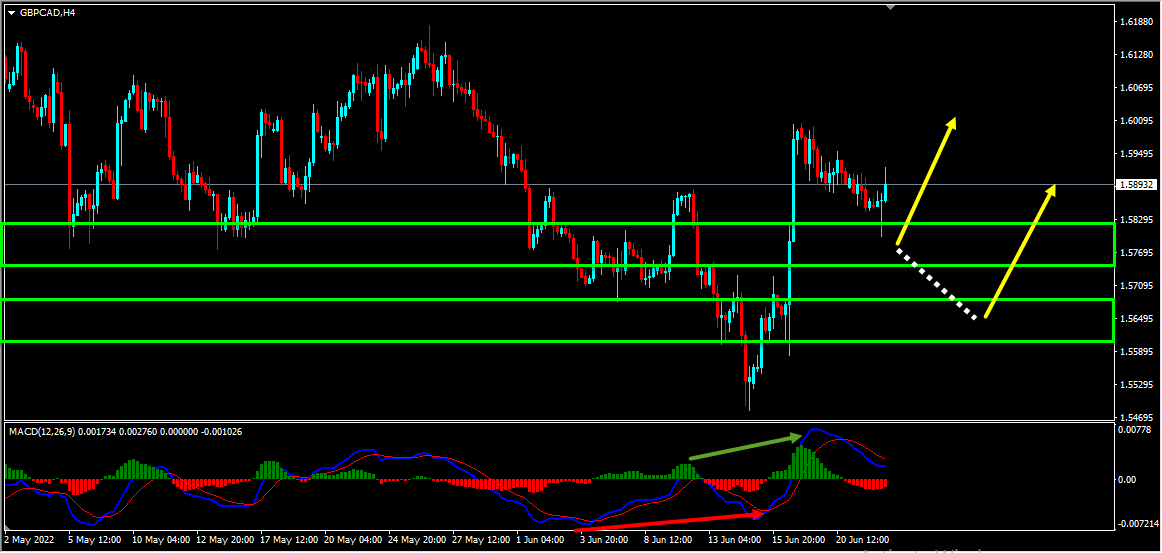
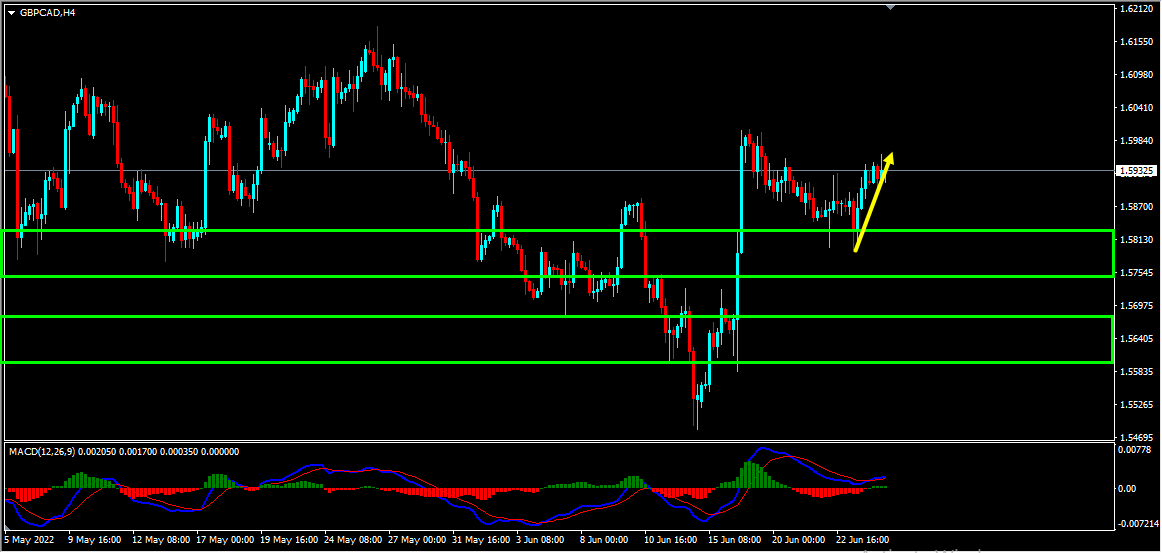
GBPCAD – My idea here was “On the H4 chart, the price which was moving lower created a bullish divergence that has formed between the first low that has formed at 1.57091 and the second low that has formed at 1.54828 based on the MACD indicator. The price then moved higher and broke above the last high at 1.58830 creating higher highs, thus forming a classical setup of bullish divergence followed by bullish convergence. Hence as per the book scenario, after a bullish convergence, we may look for corrections to happen and then further continuation to the upside. Currently it looks like a correction is happening. Also, we had two strong resistance zones that has formed and the price which was moving higher has broken above these zones and is holding above them. After the breakout these strong resistance zones are acting as two strong support zones for us. Until both these strong support zones hold my short term view remains bullish here and I expect the price to move higher further”.
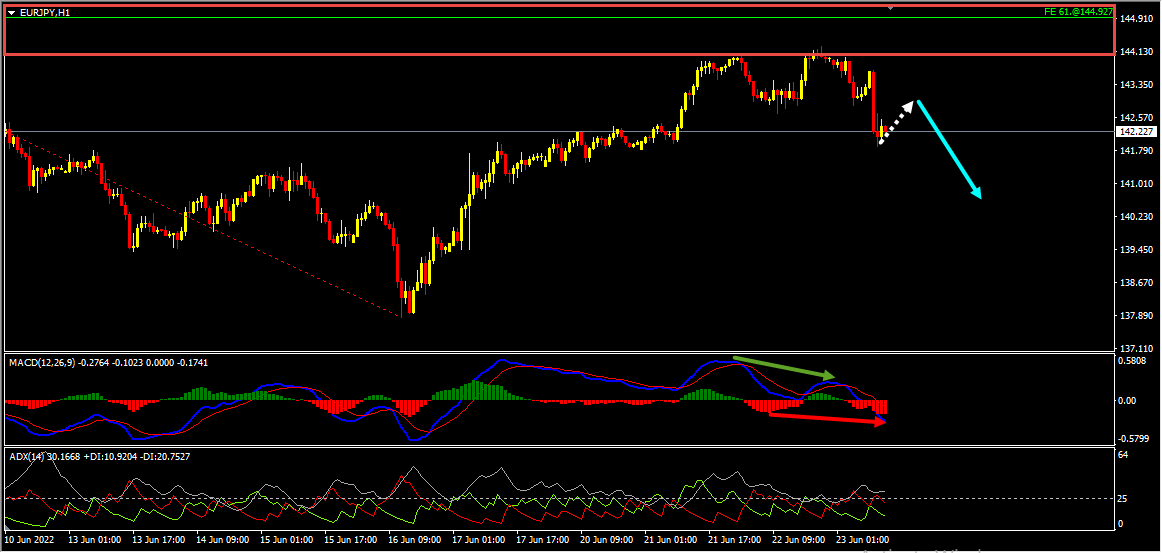
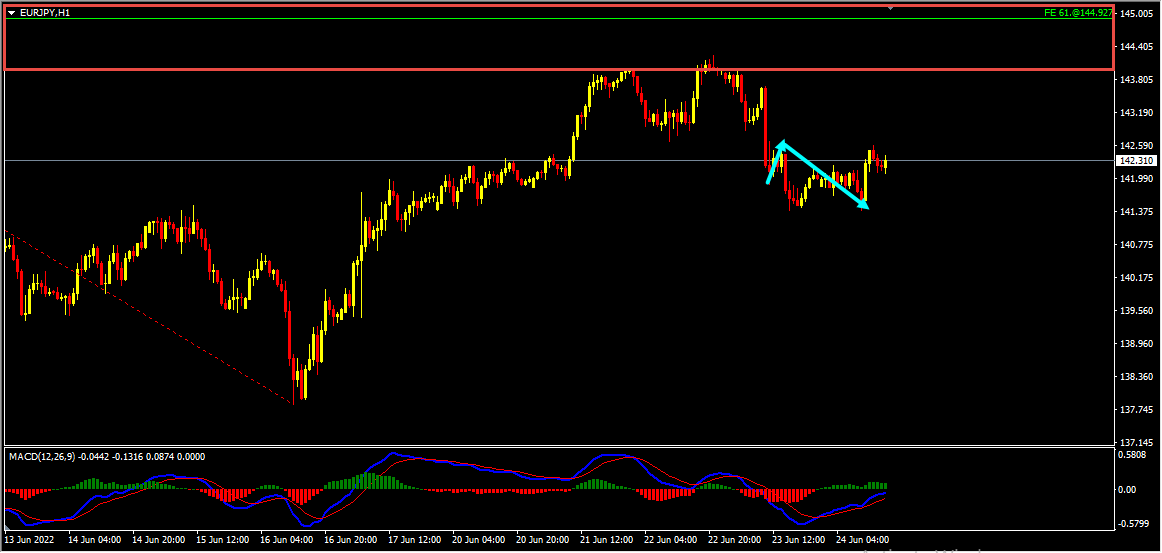
EURJPY – My idea here was “On the H1 chart, we could see that the price which was moving higher has created a bearish divergence between the first high that has formed at 144.008 and the second high that has formed at 144.243 based on the MACD indicator. The price then moved lower and broke below the last low at 142.668 creating lower lows, thus forming a classical setup of bearish divergence followed by bearish convergence, we may consider these as evidences of bearish pressure. Generally, after a bearish convergence we may look for corrections and then further continuation lower. Currently, it looks like a correction is happening. In addition to this, the ADX indicator gave a bearish signal here as well at the cross of -DI (red line) versus +DI (green line) and the main signal line (silver line) reads value over 25 which we may consider as yet another evidence of bearish pressure. Until the key resistance zone (marked in red) holds my short term view remains bearish here and I expect the price to move lower further after pullbacks”.
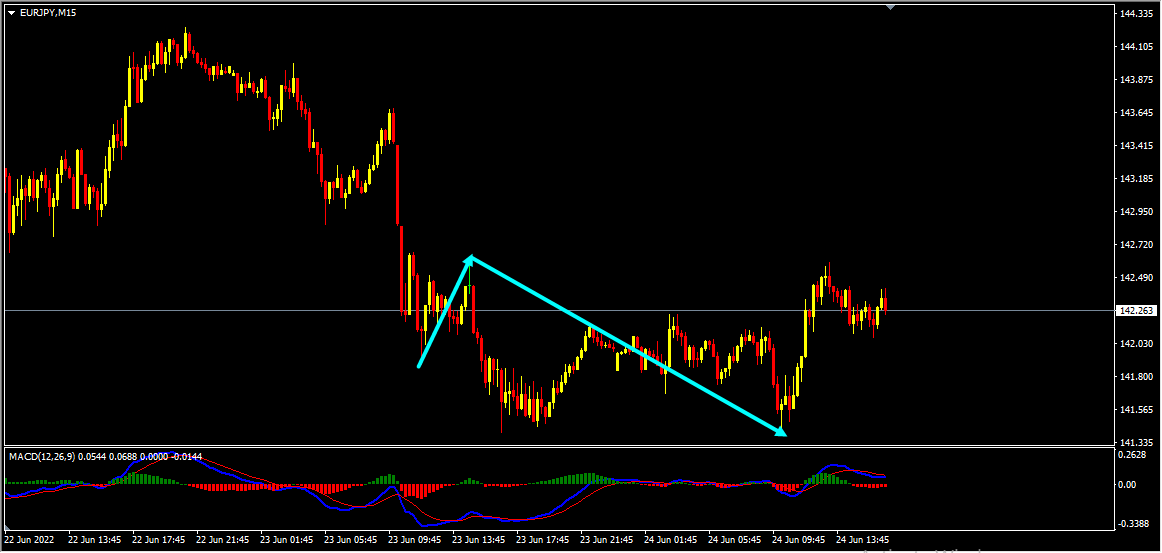
You can see this move clearly on the M15 chart below.
Note: You can follow us here on Trading View and also on our blog to get similar ideas on daily basis)
For similar trade ideas and much more I invite you to join the Traders Academy Club and improve your trading with us.
You will also find a pretty extensive database of educational materials here in the blog – just use the search or check out the Forex Education section above.
If you have any further questions, don’t hesitate to drop a comment below!
Happy Trading!
Arvinth Akash
Traders Academy Club Team.
Hi Traders! GBPAUD short term forecast and technical analysis is here. We do our analysis…
Hi Traders! USDCHF short term forecast update and follow up is here. On May 20th,…
Hi Traders! CADCHF short term forecast and technical analysis is here. We do our analysis…
The dollar was broadly steady on Monday as cautious investors watched out for signals on…
Hi Traders! Arvinth here from the Home Trader Club team. The weekly summary and, review of July…
European markets edged lower on Thursday following more overnight volatility in Asia’s tech-dominated indexes, while…