Hi Traders! Arvinth here from the Home Trader Club team. The weekly summary and, review of March 31st 2023 is here. It is now time to recap and summarize the trade setups that we had during this week. Below you will find a short explanation of all the trade setups we had this week and how it has currently developed now.
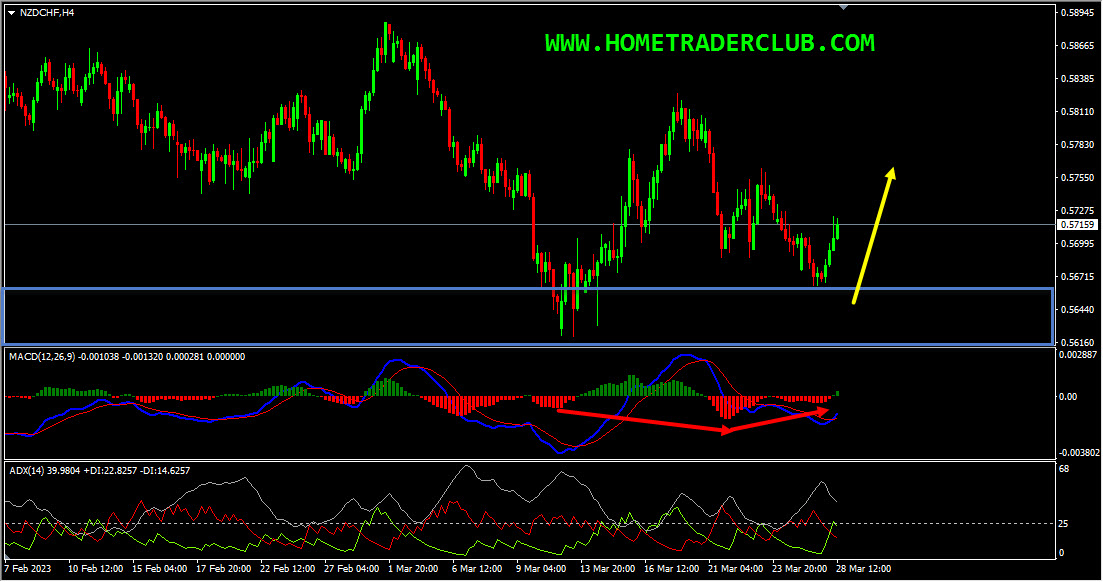
NZDCHF – My idea here was “On the H4 chart, currently, it looks like a potential double-wave correction is happening. Also, we could see that the price which was moving lower created a bullish hidden divergence between the first low that formed at 0.56215 and the second low that formed at 0.56880, followed by a continuing bullish divergence between the first low that formed at 0.56880 and the second low that has formed at 0.56642 based on the MACD indicator, which we may consider as evidence of bullish pressure. In addition to this, the ADX indicator gave a bullish signal here at the cross of +DI (green line) versus -DI (red line) and the main signal line (silver line) reads a value over 25, we may consider this as another evidence of bullish pressure. Also, currently, there are no signs opposing this short term bullish view. So everything looks good here for the bulls. Until the strong support zone (marked in blue) shown in the image below holds my short-term view remains bullish here and I expect the price to move higher further”.
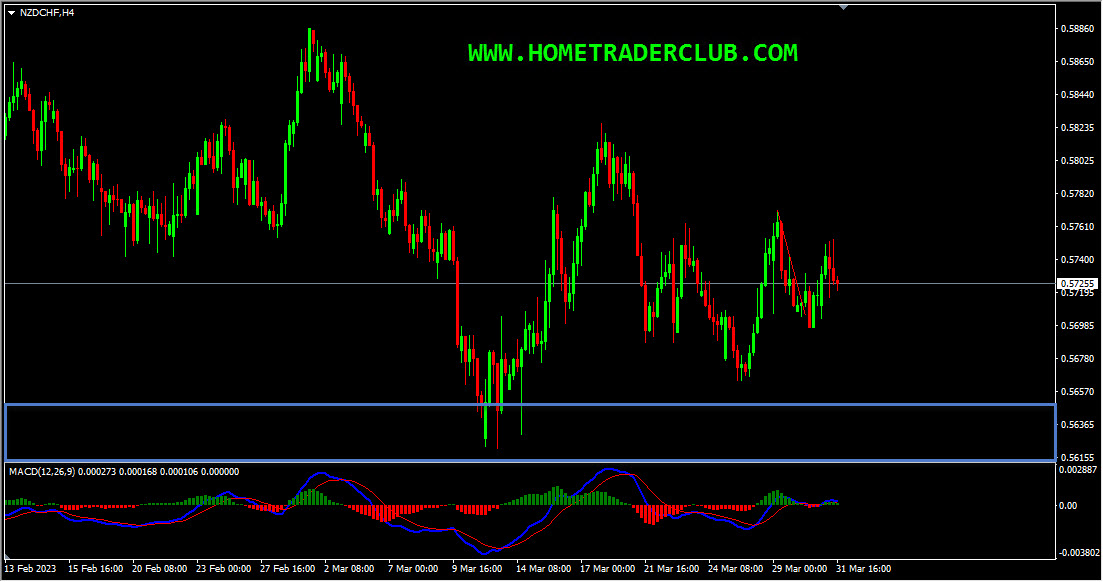
Current Scenario – In this pair, the price action is following bullish expectations so far. My plan still remains the same here, that is until the strong support zone holds my short-term view remains bullish and I expect the price to move higher further”.
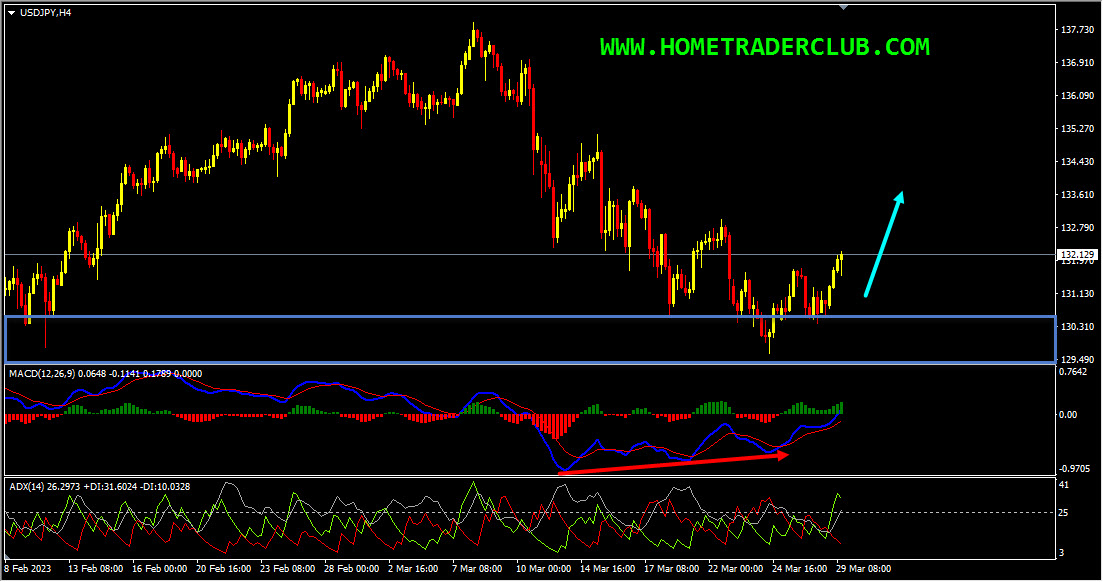
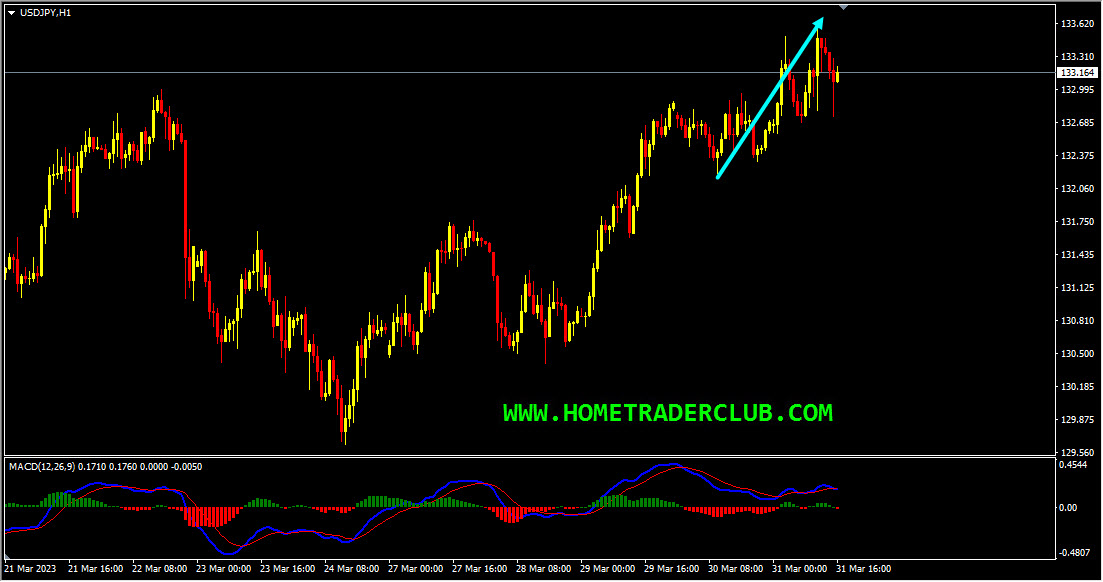
USDJPY – My idea here was “Looking at the H4 chart, we could see that the price which was moving lower has created a bullish divergence that has formed between the first low that has formed at 132.282 and the second low that has formed at 129.640 based on the MACD indicator which we may consider as evidence of bullish pressure. In addition to this, the ADX indicator gave a bullish signal here at the cross of +DI (green line) versus -DI (red line) and the main signal line (silver line) reads value over 25, we may consider this as yet another evidence of bullish pressure. Also, currently, there are no signs opposing this short term bullish view here as well. So based on all this, until the strong support zone (marked in blue) shown in the image below holds my short-term view remains bullish here and I expect the price to move higher further”.
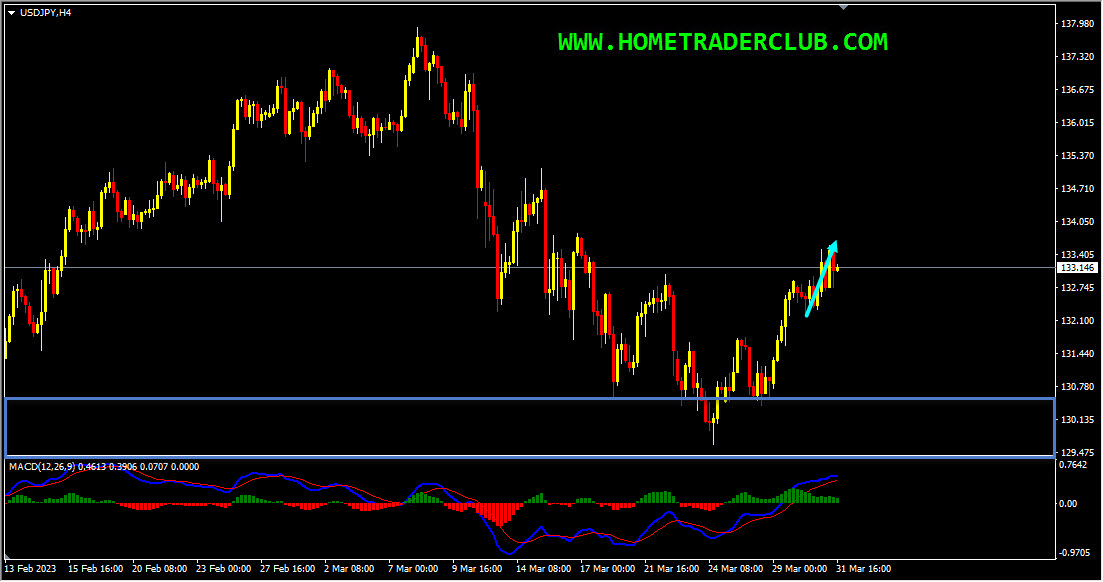
Current Scenario – In USDJPY, my short-term view was bullish and I was expecting the price to move higher further until the strong support zone holds. The price action followed my analysis exactly as I expected it to here and it moved higher further delivering 140+ pips move to the upside as you can see in the image below!
You can watch this move clearly on the H1 chart below.
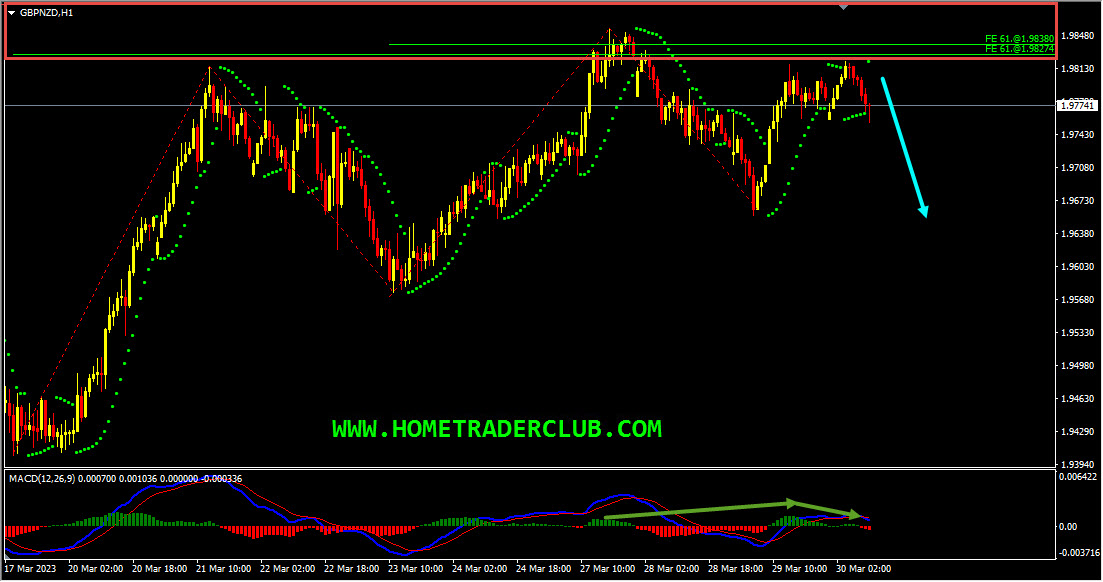
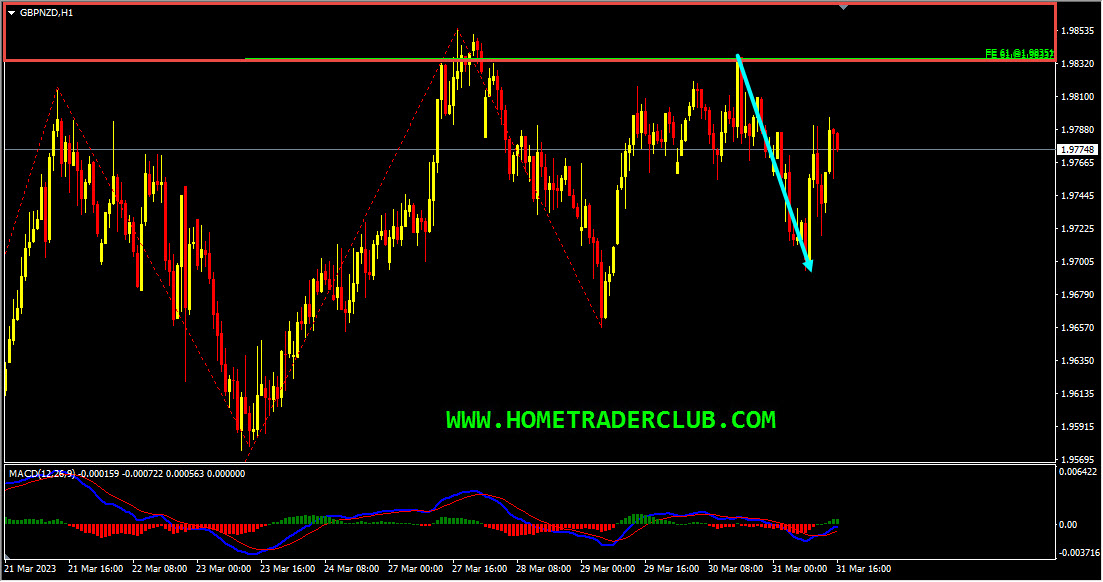
GBPNZD – My idea here was “On the H1 chart, the price which is moving higher has currently reached a key resistance zone, respected it and is bouncing lower from this zone. This key resistance zone is formed by the 61.8%(1.98274) Fibonacci expansion level of the big wave and the 61.8%(1.98380) Fibonacci expansion level of the small wave. In addition to this, we could see that the price has created a bearish hidden divergence between the first high formed at 1.98554 and the second high formed at 1.98170, followed by a continuing bearish divergence between the first high that has formed at 1.98170 and the second high that has formed at 1.98198 based on the MACD indicator, which we may consider as evidence of bearish pressure. Also, currently, there are no signs opposing this short-term bearish view. So everything looks good here for the bears and until the key resistance zone (marked in red) shown in the image below holds my short-term view remains bearish here”.
Current Scenario – In this pair, I was expecting the price to move lower further in the short term until the key resistance zone holds. The price action followed my analysis exactly as I expected it to. The price which was moving higher reached the key resistance zone again, respected it and then it bounced lower from this zone and delivered 140+ pips move!
Note: You can follow us here on Trading View and also on our blog to get similar ideas on daily basis)
For similar trade ideas and much more I invite you to join the Home Trader Club and improve your trading with us.
You will also find a pretty extensive database of educational materials here in the blog – just use the search or check out the Forex Education section above.
If you have any further questions, don’t hesitate to drop a comment below!
Happy Trading!
Arvinth Akash
Home Trader Club Team.
Hi Traders! USDCHF short term forecast update and follow up is here. On May 20th,…
Hi Traders! CADCHF short term forecast and technical analysis is here. We do our analysis…
The dollar was broadly steady on Monday as cautious investors watched out for signals on…
Hi Traders! Arvinth here from the Home Trader Club team. The weekly summary and, review of July…
European markets edged lower on Thursday following more overnight volatility in Asia’s tech-dominated indexes, while…
Hi Traders! EURGBP short term forecast and technical analysis is here. We do our analysis…