Hi Traders! Weekly summary and review October 8th, 2021 is here. It is now time to recap and summarize the trade setups that we had during this week. Below you will find the short explanation of all the trade setups we had this week and how it has currently developed now.
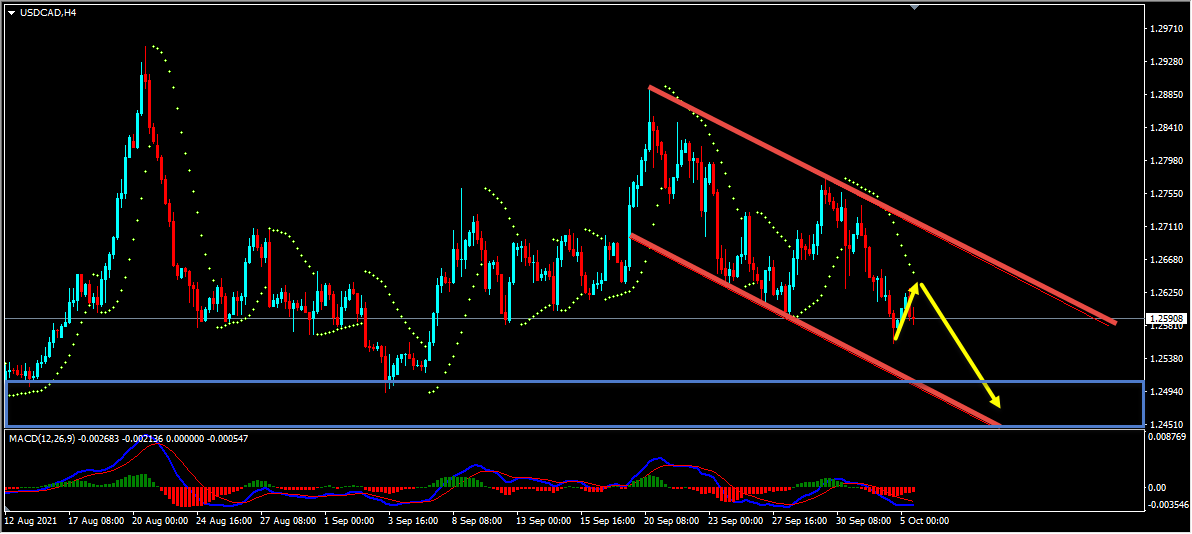
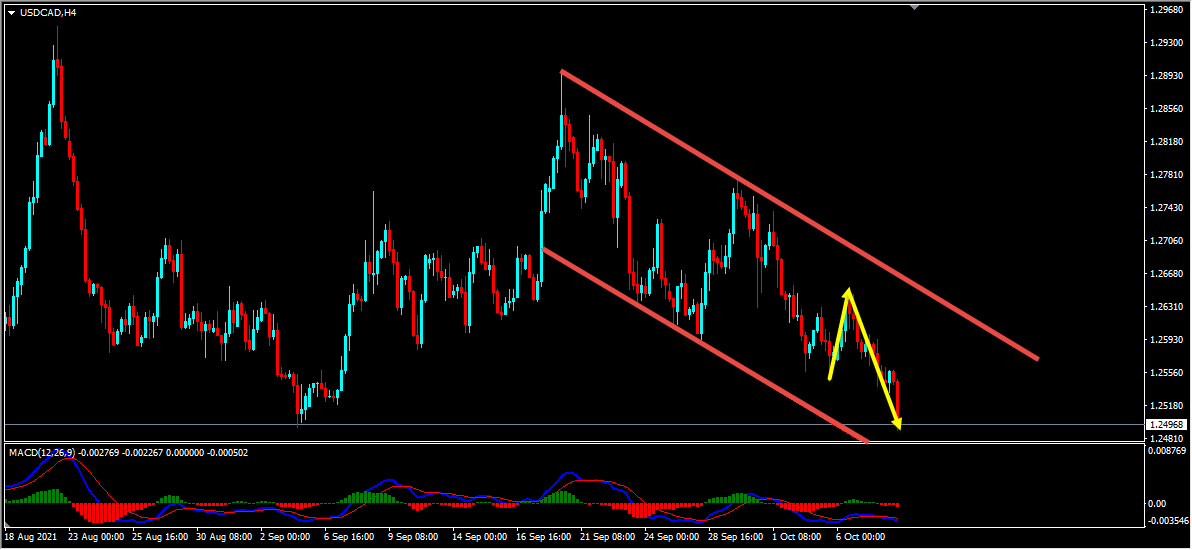
USDCAD – My idea here was “On the H4 chart, the price is currently moving inside a range. This range is formed by the highs and lows reaching parallel support and resistance zones. The price which is respecting this range so far has reached the top of it, respected it and is bouncing lower. The price has currently reached the middle of this range and the price still has room lower towards the strong support zone where the bottom of this range coincides. In addition to this, based on the Parabolic Sar we could see that the dots are above the price here as well which we may consider as another evidence of bearish pressure. So based on all this, my short term view remains bearish here and I expect the price to move lower further towards the strong support zone after pullbacks”.
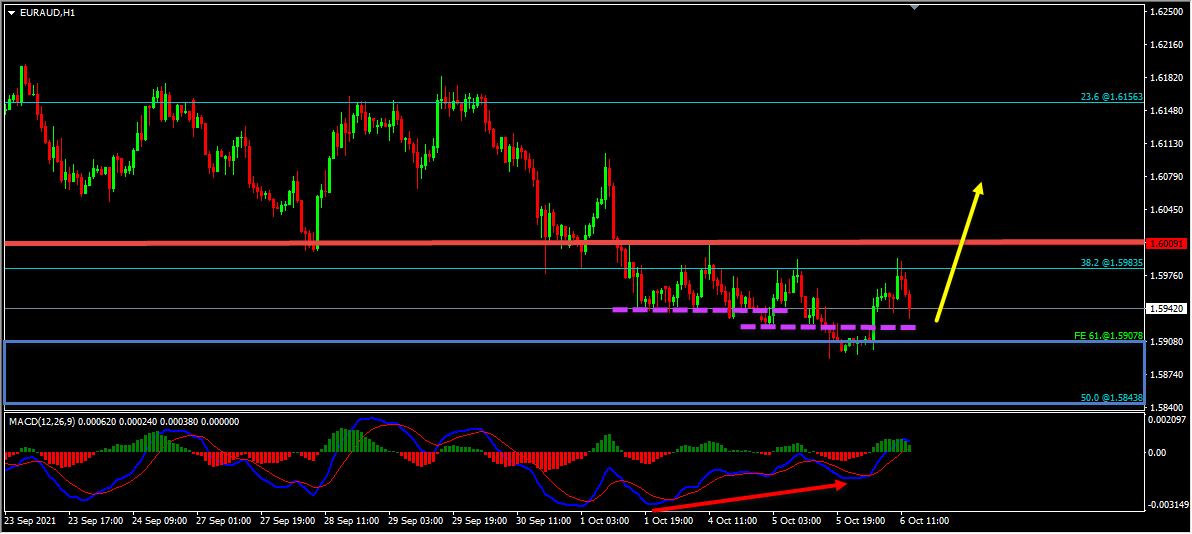
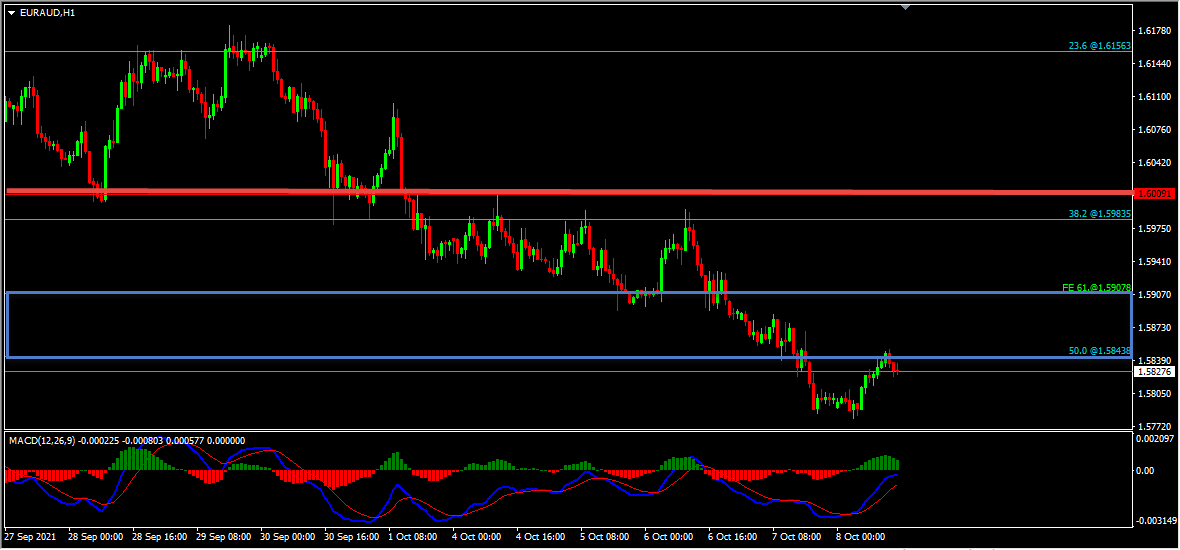
EURAUD – My idea here was “Looking at the H1 chart, we could see that the price which is moving lower has created multiple false breaks with a bullish divergence between the first low that has formed at 1.59399 and the second low that has formed at 1.58903 based on the MACD indicator, we may consider these as evidences of bullish pressure. So based on all this my view here is bullish and if the price moves higher and if we get a valid breakout above the high at 1.60091 we may then consider it as a validation for the bullish view and may expect the price to move higher further. Alternatively if the price moves lower, breaks and holds below the key support zone then this bullish view will be invalidated”.
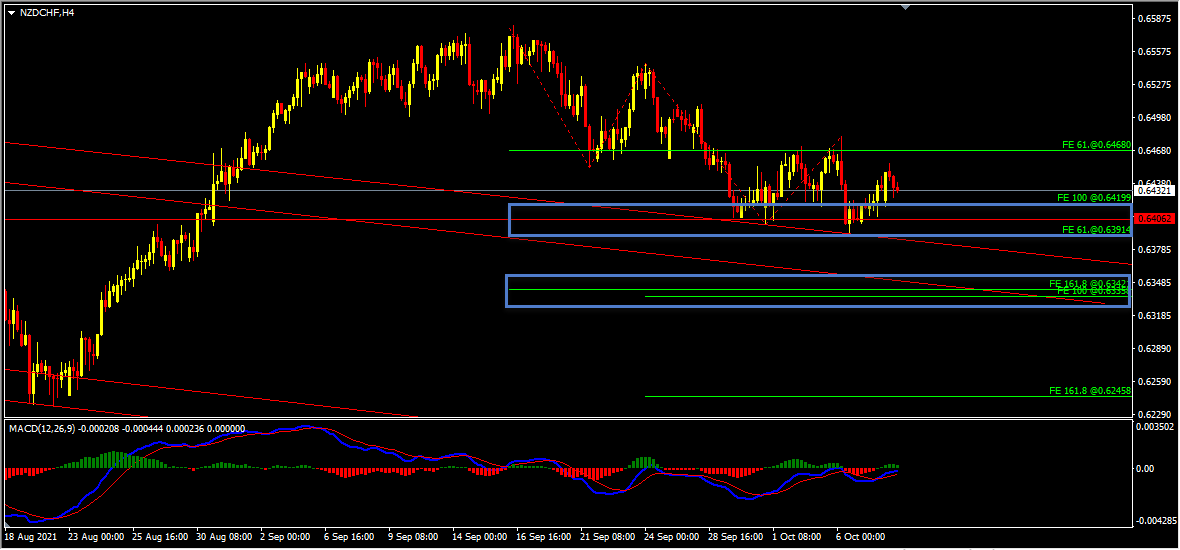
NZDCHF – My idea here was “On the H4 chart, we have two key support zones that has formed, the first key support zone is formed by the 100%(0.64178) Fibonacci expansion level of the first wave and the 61.8%(0.63899) Fibonacci expansion level of the second wave. The second key support zone is formed by the 161.8%(0.63387) Fibonacci expansion level of the first wave and the 100%(0.63334) Fibonacci expansion level of the second wave. Currently, the price which is moving lower has reached the first key support zone. We also have a bullish divergence that has formed between the first low that has formed at 0.64023 and the second low that has formed at 0.63941 based on the MACD indicator which we may consider as evidence of bullish pressure. So everything looks good here for the bulls and until the two key support zones hold my view remains bullish here and I expect the price to move higher further”.
For similar trade ideas and much more I invite you to join the Traders Academy Club and improve your trading with us.
You will also find a pretty extensive database of educational materials here in the blog – just use the search or check out the Forex Education section above.
If you have any further questions, don’t hesitate to drop a comment below!
To your success,
Vladimir Ribakov
Certified Financial Technician
Hi Traders! Arvinth here from the Home Trader Club team. The weekly summary and, review of July…
European markets edged lower on Thursday following more overnight volatility in Asia’s tech-dominated indexes, while…
Hi Traders! EURGBP short term forecast and technical analysis is here. We do our analysis…
Hi Traders! Bitcoin short term forecast update and follow up is here. On May 7th,…
Hi Traders! AUDJPY short term forecast and technical analysis is here. We do our analysis…
Hi Traders! Oil short term forecast and technical analysis is here. We do our analysis…