Hi Traders! Weekly summary and review September 17th, 2021 is here. It is now time to recap and summarize the trade setups that we had during the past week. Below you will find the short explanation of all the trade setups we had in this week and how it has currently developed now.
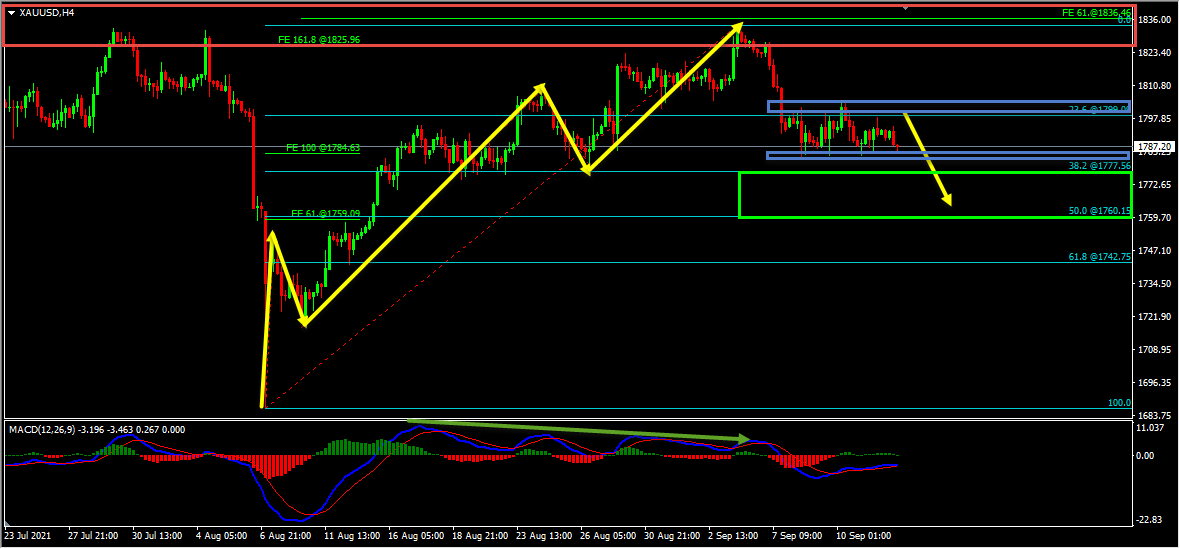
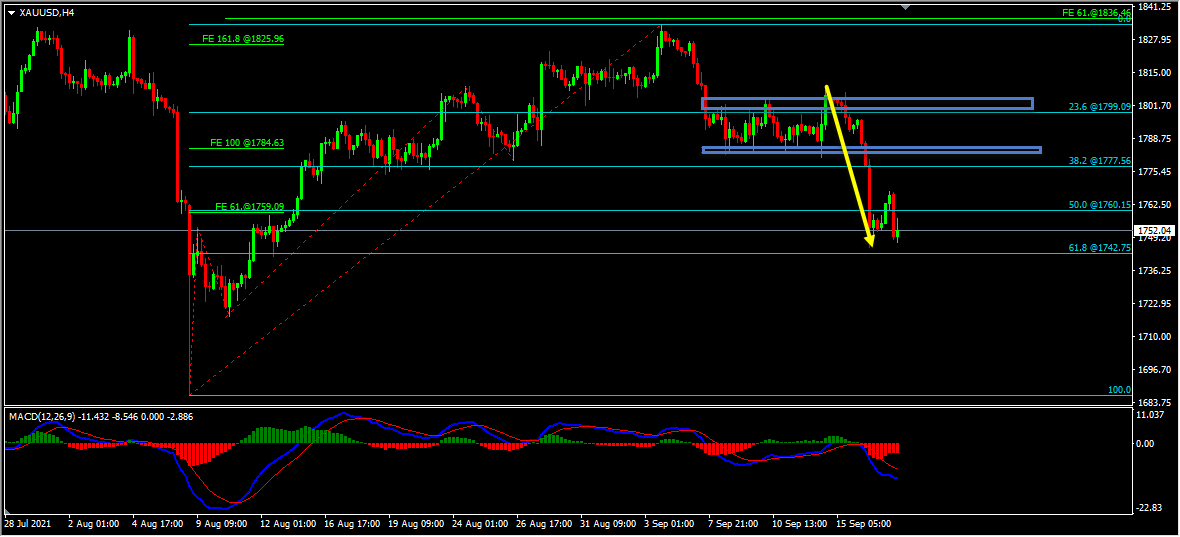
Gold – My idea here was “On the H4 chart, the price which was moving higher created a triple wave to the upside and while measuring this triple wave using the Fibonacci expansion tool we have a key resistance zone that has formed by the 161.8%(1825.96) Fibonacci expansion level of the first wave and the 61.8%(1836.46) Fibonacci expansion level of the second wave. The price respected this key resistance zone and bounced lower from this zone. We also had a bearish divergence that has formed between the first high that has formed on 17th August 2021 and the second high that has formed on 3rd September 2021 based on the MACD indicator which we may consider as evidence of bearish pressure. Currently it looks like a correction is happening, after the first leg to the downside, it looks like a flat correction is happening in the form of a range now. Until the top of this range holds my short term view remains bearish here and I expect the price to move lower further towards the key support zone formed the 38.2%(1777.56) – 50%(1760.15) Fibonacci retracement zones of the triple cycle”.
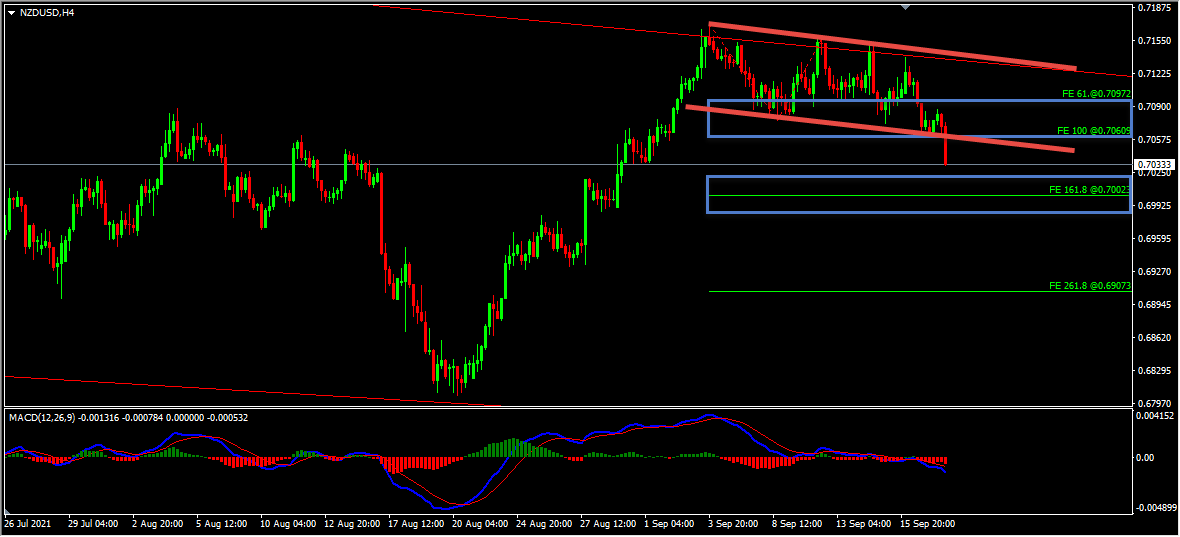
NZDUSD – My idea here was “Looking at the H4 chart, we could see that currently it looks like a flat correction is happening in the form of a range. While measuring the first wave inside this range we have two key support zones that has formed. The first key support zone is formed by the 61.8%(0.70972) – 100%(0.70609) Fibonacci expansion levels of the first wave and the bottom of the range. The second key support zone is formed by the 161.8%(0.70023) Fibonacci expansion level of the first wave. The price has currently reached the first key support zone and also we have a bullish divergence that has formed between the first low that has formed at 0.70759 and the second low that has formed at 0.70730 based on the MACD indicator which we may consider as evidence of bullish pressure. Until both the key support zones hold my view remains bullish here. If the price breaks and holds above the top of this range we may then consider it as validation for the bullish view and may expect the price to move higher further”.
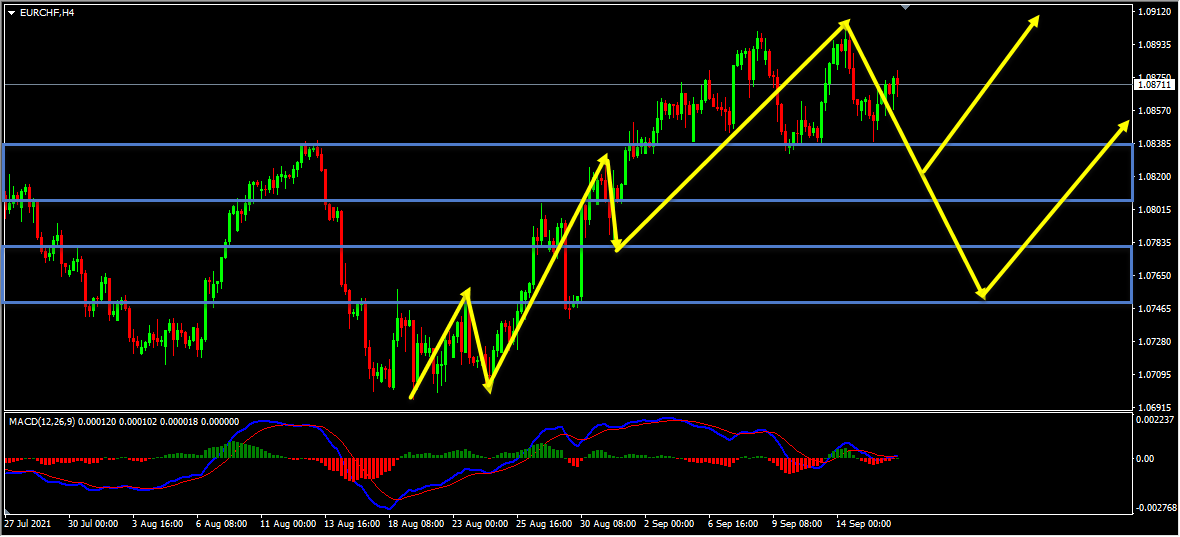
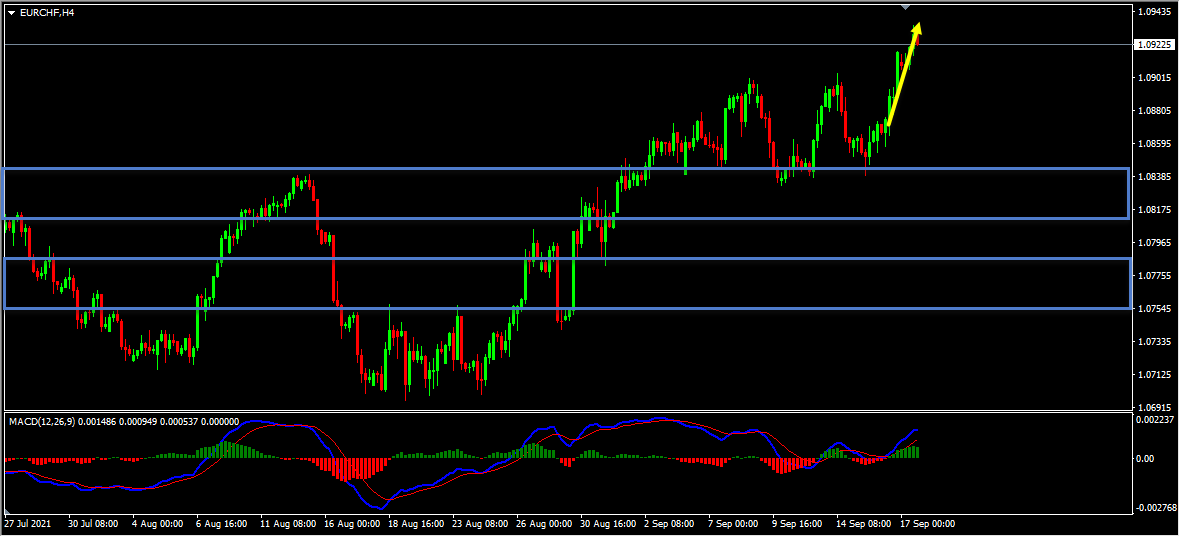
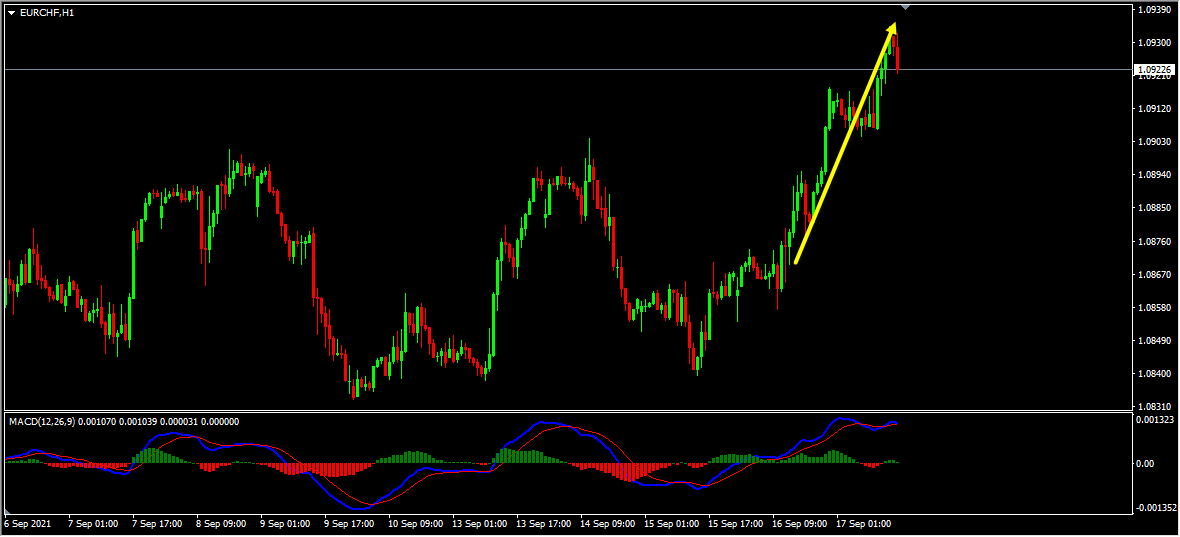
EURCHF – My idea here was “On the H4 chart the price which is moving higher has created a bullish trend pattern in the form of three higher highs, higher lows, we may consider this as evidence of bullish pressure. Generally, after a bullish trend pattern, we may expect corrections and then potential continuation higher. Currently, it looks like a correction is happening, also we had two strong resistance zones that has formed and the price which was moving higher has broken above these zones and is holding above them. After the breakout these strong resistance zones are acting as two strong support zones for us. Until both these strong support zones hold my view remains bullish here and I expect the price to move higher further”.
For similar trade ideas and much more I invite you to join the Traders Academy Club and improve your trading with us.
You will also find a pretty extensive database of educational materials here in the blog – just use the search or check out the Forex Education section above.
If you have any further questions, don’t hesitate to drop a comment below!
To your success,
Vladimir Ribakov
Certified Financial Technician
Hi Traders! Arvinth here from the Home Trader Club team. The weekly summary and, review of July…
The Japanese yen surged on Thursday, in a move analysts said bore the hallmarks of…
Hi Traders! EURAUD short term forecast and technical analysis is here. We do our analysis…
Hi Traders! NZDCAD short term forecast update and follow up is here. On June 2nd,…
Hi Traders! NZDCHF short term forecast and technical analysis is here. We do our analysis…
Hi Traders! AUDUSD short term forecast follow-up and update is here. On May 27th 2026…