Hi Traders! AUDUSD technical analysis and short term forecast post is here. We do our analysis on the MetaTrader4 platform (MT4), some very interesting, useful tips and hacks about the MT4 platform could be found here. If you would like to learn more about the way we trade and the technical analysis we use then check out the Home Trader Club Spoiler alert – free memberships are available! In this pair we are going to perform the top – down analysis in order to find possible trading opportunities. Let’s start our analysis now from the highest timeframe which will be the daily chart here.
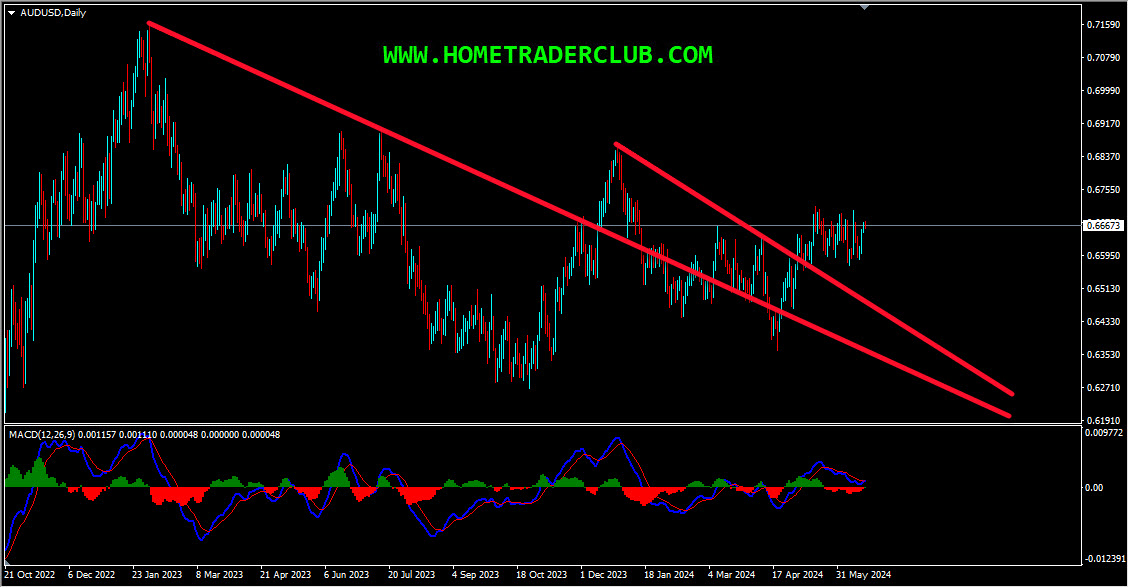
On the daily chart, the price which was moving lower made a turn around and the price moved higher and broke above the downtrend line, which we may consider as evidence of bullish pressure. We then had a correction and then the price moved higher again and has also broken above the most recent downtrend line, which we may consider as yet another evidence of bullish pressure. Currently it looks like a correction is happening and in addition to this, there are no signs opposing this short term bullish view at the moment. So everything looks good here for the bulls and we may now move down to one timeframe lower and look for evidences supporting this short term bullish view.
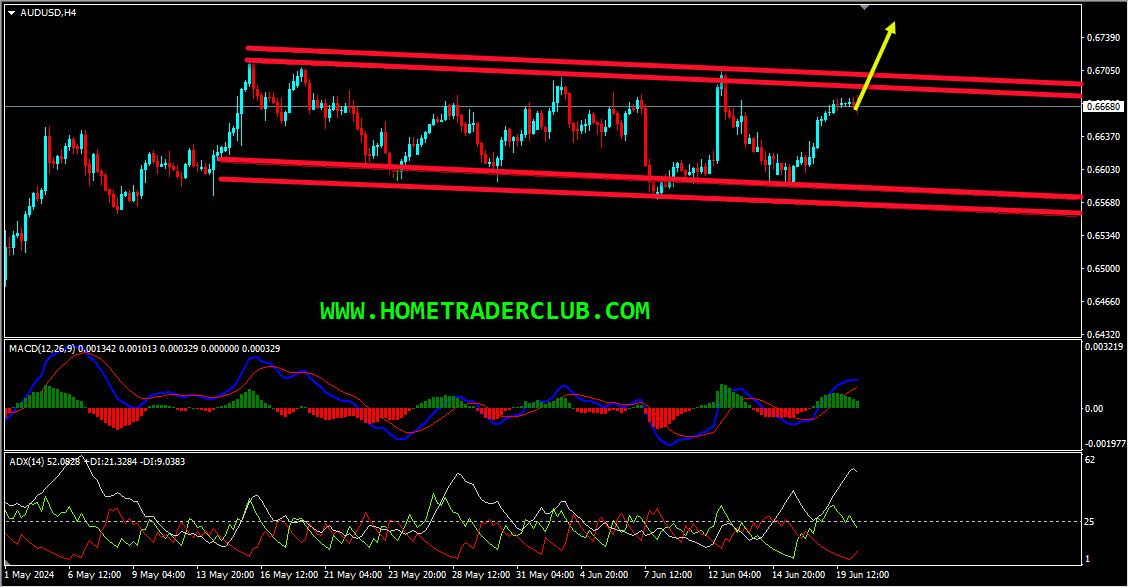
On the H4 chart, after the strong bullish move currently, it looks like a correction is happening in the form of a range. This range is formed by the highs and lows reaching parallel support and resistance zones. The price which is moving inside this range has currently reached near the top of the range. In addition to this, the ADX indicator gave a bullish signal here at the cross of +DI (green line) versus -DI (red line) and the main signal line (silver line) reads value over 25, we may consider this as evidence of bullish pressure. So everything looks good here for the bulls and a valid breakout above the top of the range would be the validation for this bullish view. Alternatively, if we get a valid breakout below the bottom of this range then this bullish view will be invalidated.
AUDUSD D1(Daily) Chart Analysis
AUDUSD H4(4 Hours) Chart Analysis
It is always recommended to look for confirmations before you jump into any trade. If you are not sure about how to trade this short-term buy setup then you can use any setup and strategy that you have in your arsenal to look for bullish moves and join this buy trade.
Also, don’t forget to protect your buy trade using a stop loss and make sure to set a target and keep a proper risk/reward ratio.
You will also find a pretty extensive database of educational materials here in the blog – just use the search or check out the Forex Education section above.
Not sure how to enter a trade? Spot reversals (bounces)? Not sure how to spot breakouts?
I invite you to
And improve your trading with us.
Also, you can get one of our strategies free of charge. You will find all the details here
Download our best forex indicators here
If you have any further questions, don’t hesitate to drop a comment below!
Happy Trading!
Arvinth Akash
Home Trader Club Team.
Hi Traders! NZDUSD short term forecast and technical analysis is here. We do our analysis…
We are pleased to officially announce our new partnership with AvaTrade, one of the most…
Hi Traders! EURUSD short term forecast and technical analysis is here. We do our analysis…
Welcome to this week’s Forex forecast. In this analysis, we break down the key technical…
Hi Traders! Arvinth here from the Home Trader Club team. The weekly summary and, review of April…
Stocks and bonds fell as oil surged anew, with President Donald Trump dashing optimism that the war in…