Hi Traders! CADJPY technical analysis and short term forecast post is here. We do our analysis on the MetaTrader4 platform (MT4), some very interesting, useful tips and hacks about the MT4 platform could be found here. If you would like to learn more about the way we trade and the technical analysis we use then check out the Home Trader Club Spoiler alert – free memberships are available! In CADJPY we are going to perform the top – down analysis in order to find possible trading opportunities. Let’s start our analysis now from the highest timeframe which will be the H4 chart here.
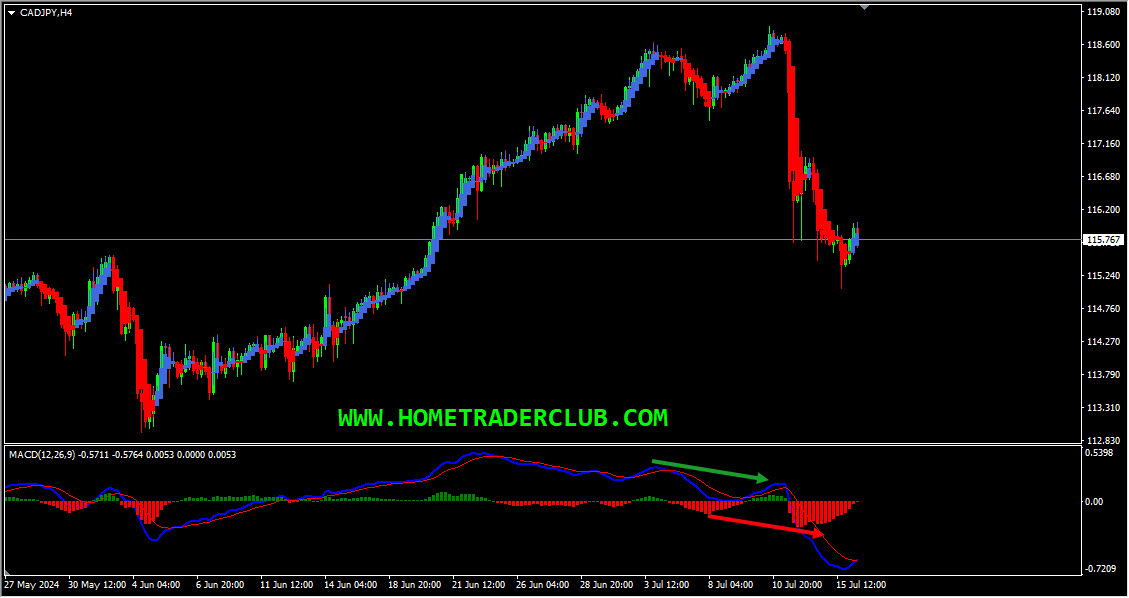
On the H4 chart, currently, we have a strong bearish momentum and based on the Heikin Ashi candles we can see that currently, we have strong bearish bodies in downward moving market conditions so it basically reflects a bearish environment. In addition to this, we have a bearish divergence that has formed between the first high that has formed at 118.624 and the second high that has formed at 118.857 based on the MACD indicator. The price then moved lower and broke below the last low at 117.494 thus forming a classical setup of bearish divergence followed by bearish convergence, we may consider this as evidence of bearish pressure. As per the book scenario after a bearish convergence we may expect corrections and then further continuation lower. Currently it looks like a correction is happening. So everything looks good here for the bears and we may now move down to lower timeframe and look for evidences supporting this short term bearish view.
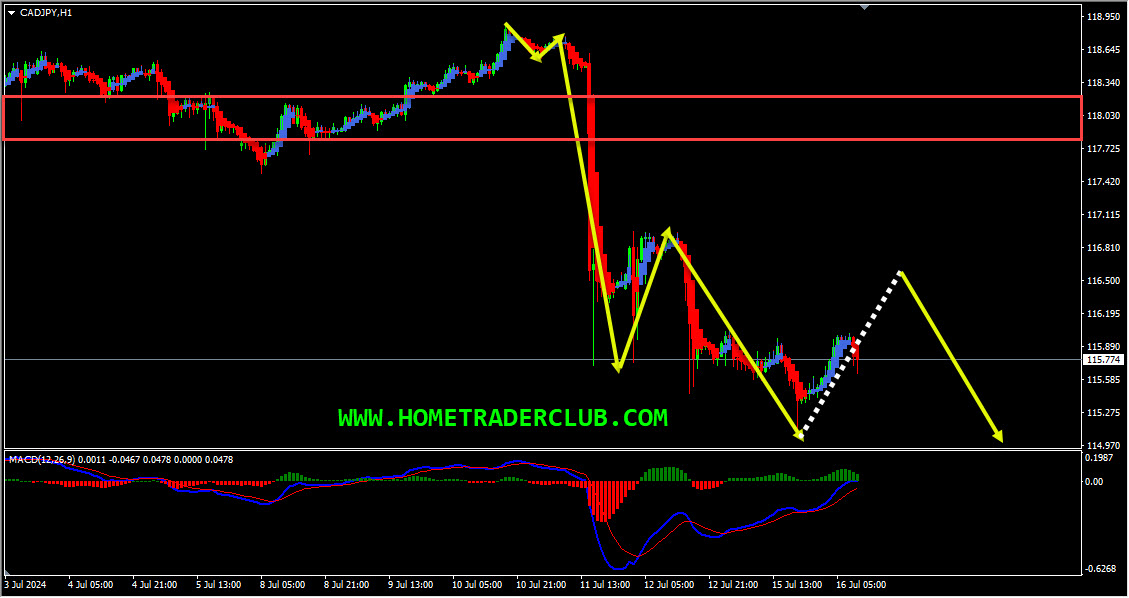
On the H1 chart, based on the Heikin Ashi candles we can see that currently, we have strong bearish bodies in downward-moving market conditions so it basically reflects a bearish environment. In addition to this, the price which is moving lower has created a bearish trend pattern in the form of three lower highs, and lower lows which we may consider as evidence of bearish pressure. Generally, after a bearish trend pattern, we may expect corrections and then a further continuation lower. Currently, it looks like a correction is happening. Also, we had a strong support zone that has formed and the price which is moving lower has broken below this zone and is holding below it, we may consider this as yet another evidence of bearish pressure. Currently, this strong support zone is acting as a strong resistance zone for us. Until this strong resistance zone (marked in red) shown in the image below holds my short term view remains bearish here and I expect the price to move lower further after pullbacks.
CADJPY H4(4 Hours) Chart Analysis
CADJPY H1(1 Hour) Chart Analysis
It is always recommended to look for confirmations before you jump into any trade. If you are not sure about how to trade this short-term sell setup then you can use any setup and strategy that you have in your arsenal to look for bearish moves and join this sell trade.
Also, don’t forget to protect your sell trade using a stop loss and make sure to set a target and keep a proper risk/reward ratio.
You will also find a pretty extensive database of educational materials here in the blog – just use the search or check out the Forex Education section above.
Not sure how to enter a trade? Spot reversals (bounces)? Not sure how to spot breakouts?
I invite you to
And improve your trading with us.
Also, you can get one of our strategies free of charge. You will find all the details here
Download our best forex indicators here
If you have any further questions, don’t hesitate to drop a comment below!
Happy Trading!
Arvinth Akash
Home Trader Club Team.
Hi Traders! NZDUSD short term forecast and technical analysis is here. We do our analysis…
We are pleased to officially announce our new partnership with AvaTrade, one of the most…
Hi Traders! EURUSD short term forecast and technical analysis is here. We do our analysis…
Welcome to this week’s Forex forecast. In this analysis, we break down the key technical…
Hi Traders! Arvinth here from the Home Trader Club team. The weekly summary and, review of April…
Stocks and bonds fell as oil surged anew, with President Donald Trump dashing optimism that the war in…