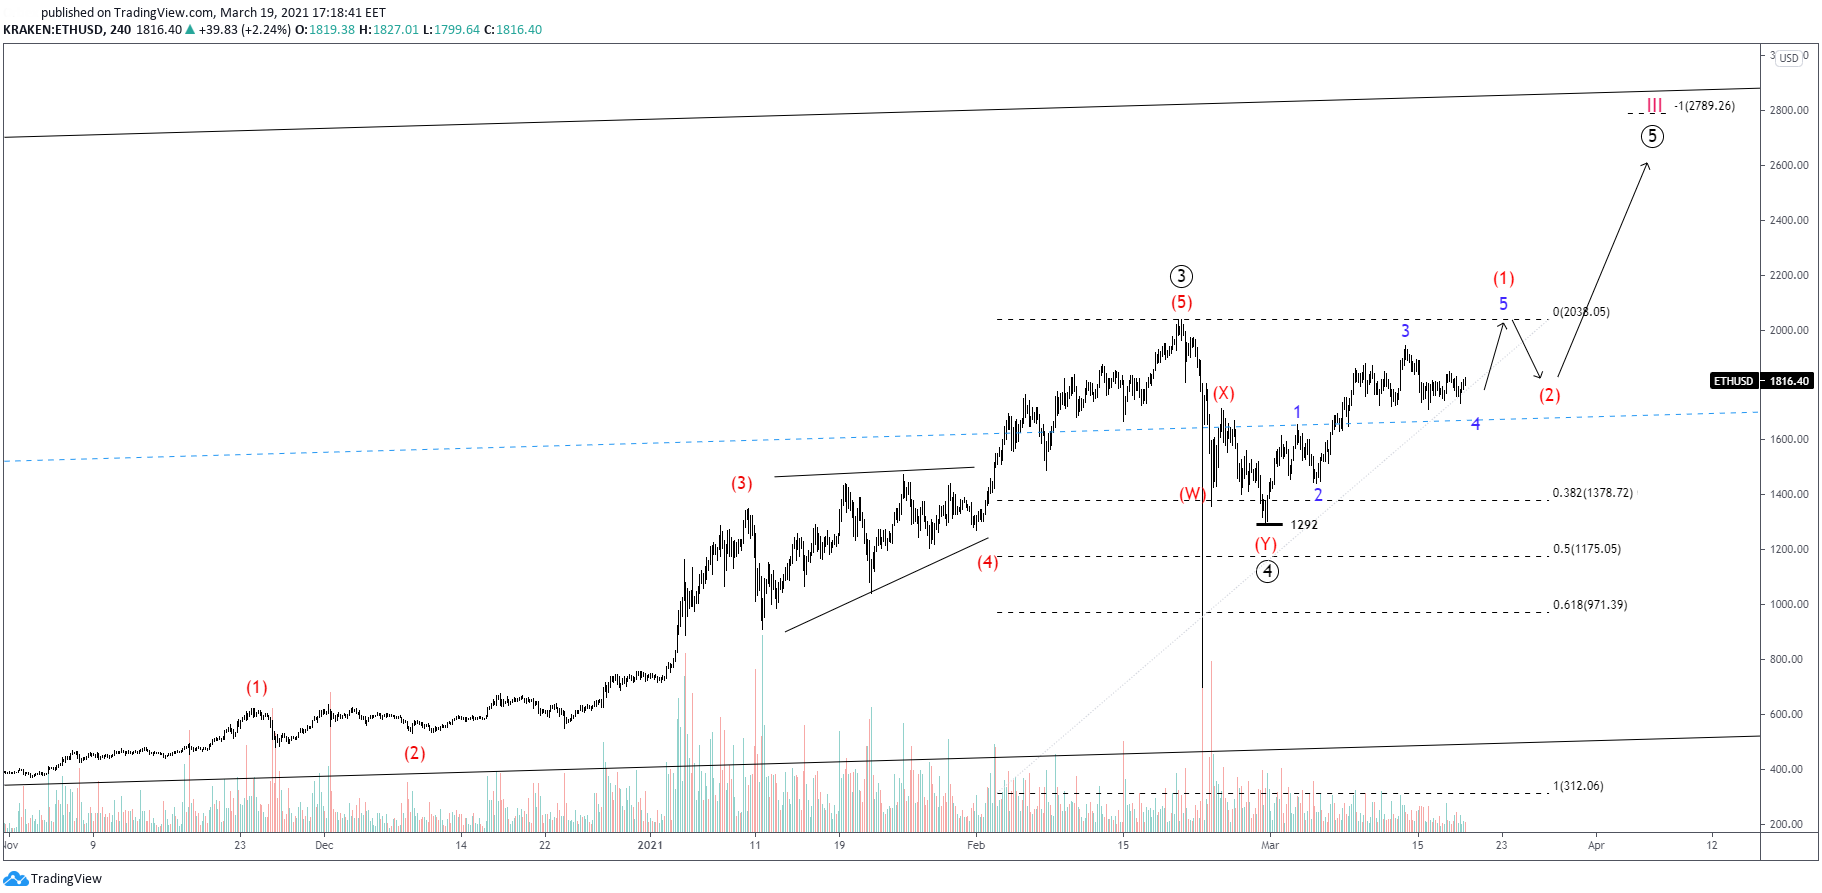
The prices of Ethereum remain bullish in the medium and long term as we are only trading in cycle wave III. In addition, ETHUSD is currently on an impulsive ride, trading above the mean regression (blue dashedline) of the cycle-degree ascending channel. However, the short term trajectory of ETH comes with its perks. Let’s clear the picture out a little bitby examining a couple of probable scenarios.
In my main scenario, and despite the structure from the low of $1292 being impulsive, when adding the decline from the all-time-high of $2038 in the picture, the structure reminds both a regular flat and a simple zigzag pattern.
Flats are made of a 3-3-5 pattern, currently seen in the intermediate degree (A)(B)(C) correction. With waves (A) and (B) complete, prices could start falling towards the previous low in wave (C).
Simple zigzags, on the other hand, are made of a 5-3-5 pattern, as seen in the same degree.
The difference between the two is that in the former case, prices can be expected to reach a local low, form a double bottom near $1292 and shoot higher. Whereas in the latter case, prices can be expected to register a fresh low.
Most often, simple zigzags extend 100% of waves one and two (or (A) and (B) in this case). This brings us to a low of $1197, which happens to be very near the 50% Fibonacci retracement of primary wave ③,thus, making that a cluster.
In my alternative scenario, and since (as mentioned earlier) the structure from the low of $1292 is impulsive, the correction could have already ended with a double three pattern. As such, the recent correction from minor wave 3 (blue), is only part of a 5-wave impulse in intermediate wave (1).
With primary wave ② registering a 50% correction, it is relatively hard to use the rule of alternation to guestimate how deep the correction in primary wave ④ could be. Therefore, any of the scenarios could take place. In the short-term, attention should remain on the break above blue 3 or below blue 1.
About the Author
You can follow Stavros on Twitter and Linkedin here: twitter.com/StavrosTousios & linkedin.com/in/stavrostousios/
Interest rates are one of the most important fundamental forces in the Forex market. But…
The latest U.S. employment report has delivered a significant warning for the market. With only…
The Forex market does not always offer clear trading opportunities. Sometimes, price moves sharply in…
Open social media for a few minutes and you can easily find someone talking about…
EURUSD, GBPUSD, USDJPY, Gold and Bitcoin remain at important technical levels as volatility and geopolitical…
A winning trade feels good. A series of winning trades feels even better. Confidence increases.…