Hi Traders! Gold technical analysis and forecast is here. The way I would like to analyze the chart for setups is based on multi-timeframe confirmations because in my POV if we get more evidences on different timeframes for the same direction then it makes the setup much more reliable. If you would like to learn more about the way we trade and the technical analysis we use then check out the Traders Academy Club Spoiler alert – free memberships are available!
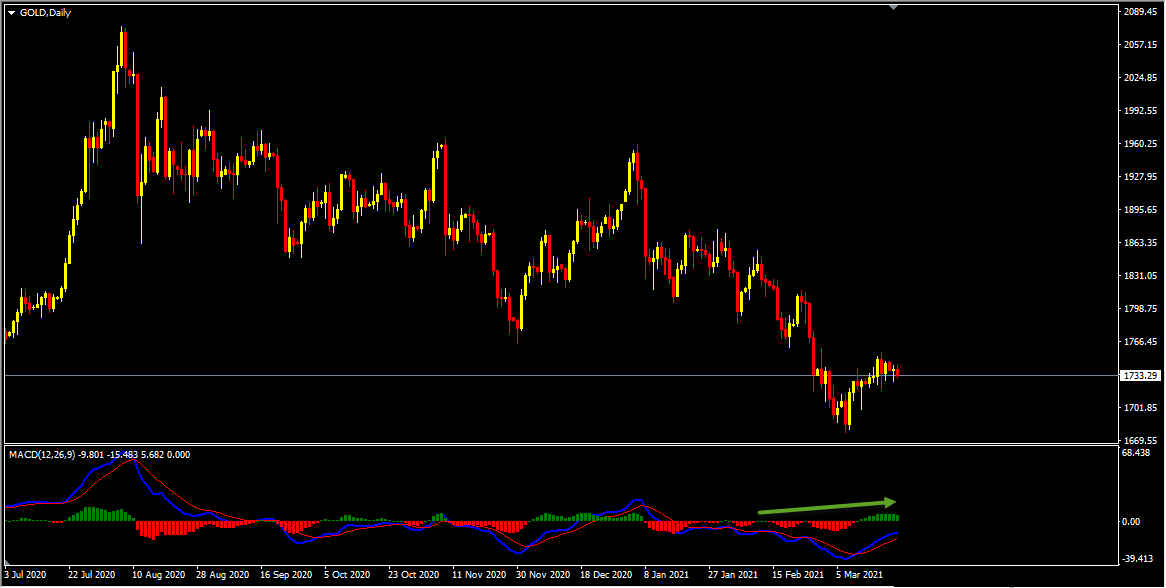
On the daily chart, the price which is moving lower has created a series of lower lows, lower highs which basically represents a bearish trend. Currently, it looks like a correction is happening. In addition to this, we have a bearish hidden divergence that has formed between the first high that has formed on 10th February 2021 and the second high that has formed on 18th March 2021 based on the MACD indicator which we may consider as evidence of bearish pressure. So everything looks good here for the bears and we may now move down to lower timeframe and see if we can find evidences supporting this bearish view.
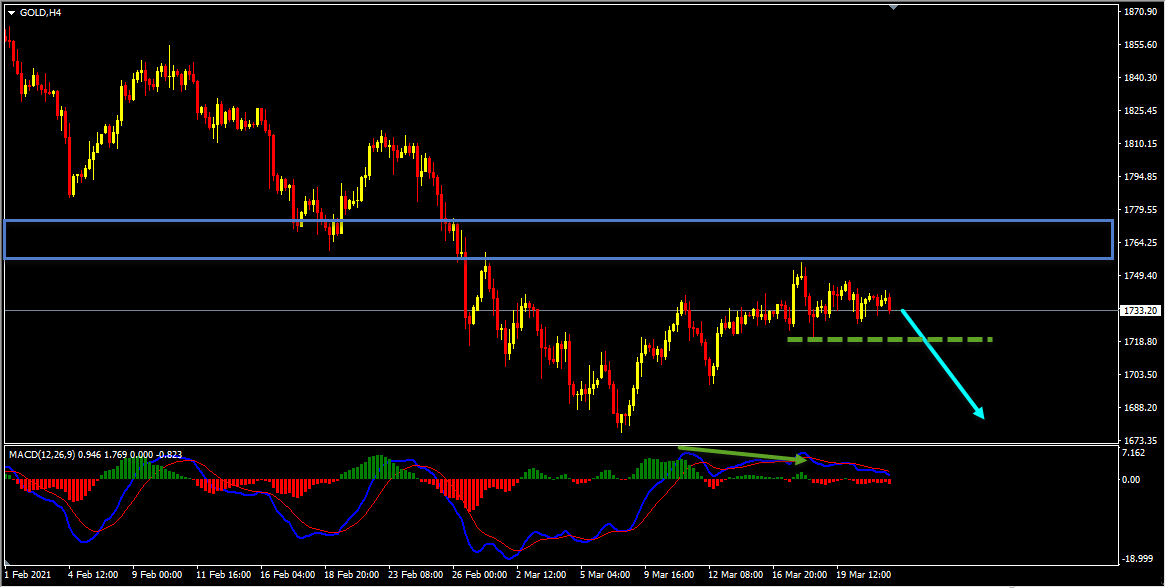
On the H4 chart, we had a strong support zone that has formed and the price which is moving lower has broken below this zone and is holding below it. Currently, this strong support zone is acting as a strong resistance zone for us. Until this strong resistance zone holds my view remains bearish here and I expect the price to continue lower further. Currently, it looks like the daily correction is happening in the form of double wave to the upside on the H4 chart. In addition to this, we have a bearish divergence that has formed between the first high that has formed on 11th March 2021 and the second high that has formed on 18th March 2021 based on the MACD indicator, we may consider this as evidence of bearish pressure. There are two possible scenarios from here which are as follows:
Scenario 1: If the price moves lower from the current zone and if we get a valid breakout below the low at 1719.21, we may then consider it as evidence of bearish pressure and may expect the price to move lower further.
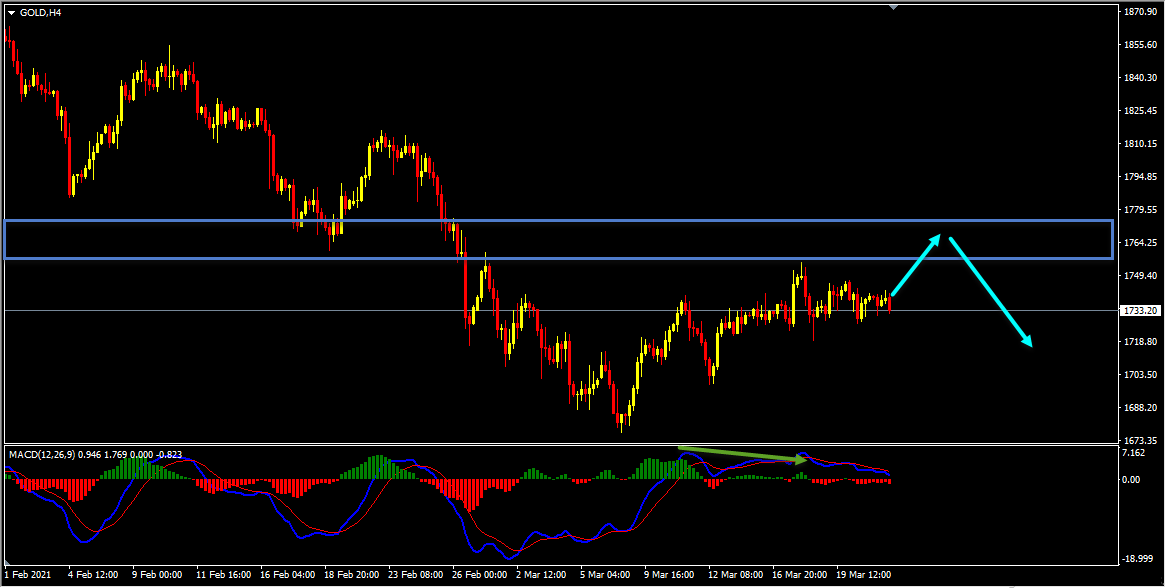
Scenario 2: Alternatively if the price moves higher then the price might provide one more push higher towards the strong resistance zone and then we may look for bearish setups with bearish evidences from this zone.
Gold D1(Daily) Chart Analysis
Gold H4(4 Hours) Chart Analysis
It is always recommended to look for confirmations before you jump into any trade. If you are not sure about how to trade this sell setup then you can use any setup and strategy that you have in your arsenal to look for bearish moves and join this sell trade.
Also don’t forget to protect your sell trade using a stop loss and make sure to set a target and keep a proper risk/reward ratio.
You will also find a pretty extensive database of educational materials here in the blog – just use the search or check out the Forex Education section above.
Not sure how to enter a trade? Spot reversals (bounces)? Not sure how to spot breakouts?
I invite you to join us in our live market analysis, on daily basis, and improve your trading with us.
Also, you can get one of our strategies free of charge. You will find all the details here
If you have any further questions, don’t hesitate to drop a comment below!
Happy Trading!
Yordan Kuzmanov
Chief Trader at the Traders Academy Club
Hi Traders! Arvinth here from the Home Trader Club team. The weekly summary and, review of July…
European markets edged lower on Thursday following more overnight volatility in Asia’s tech-dominated indexes, while…
Hi Traders! EURGBP short term forecast and technical analysis is here. We do our analysis…
Hi Traders! Bitcoin short term forecast update and follow up is here. On May 7th,…
Hi Traders! AUDJPY short term forecast and technical analysis is here. We do our analysis…
Hi Traders! Oil short term forecast and technical analysis is here. We do our analysis…