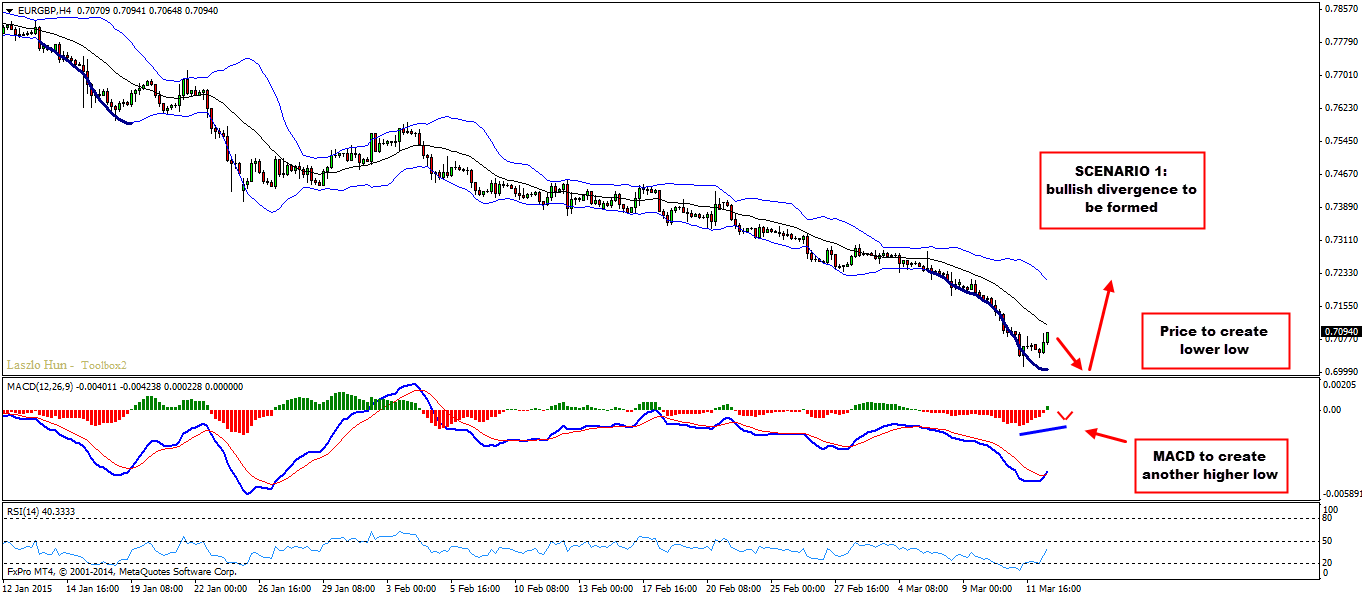
EURGBP is respecting the support zone we are closely following. Now it is time to find a good buy opportunity and try to join the bullish move. Looking at the H4 chart we can expect the pair to either:
Here is a reminder of the Monthly monster support ahead. So as long as the price is holding the last low we can expect it to push higher first of all to the daily 20 MA, then the opposite band of the bollinger bands.
Entry:
Scenario 1
H4 – if price pushes lower to form bullish divergence we will attack from the bottom (see screenshot above)
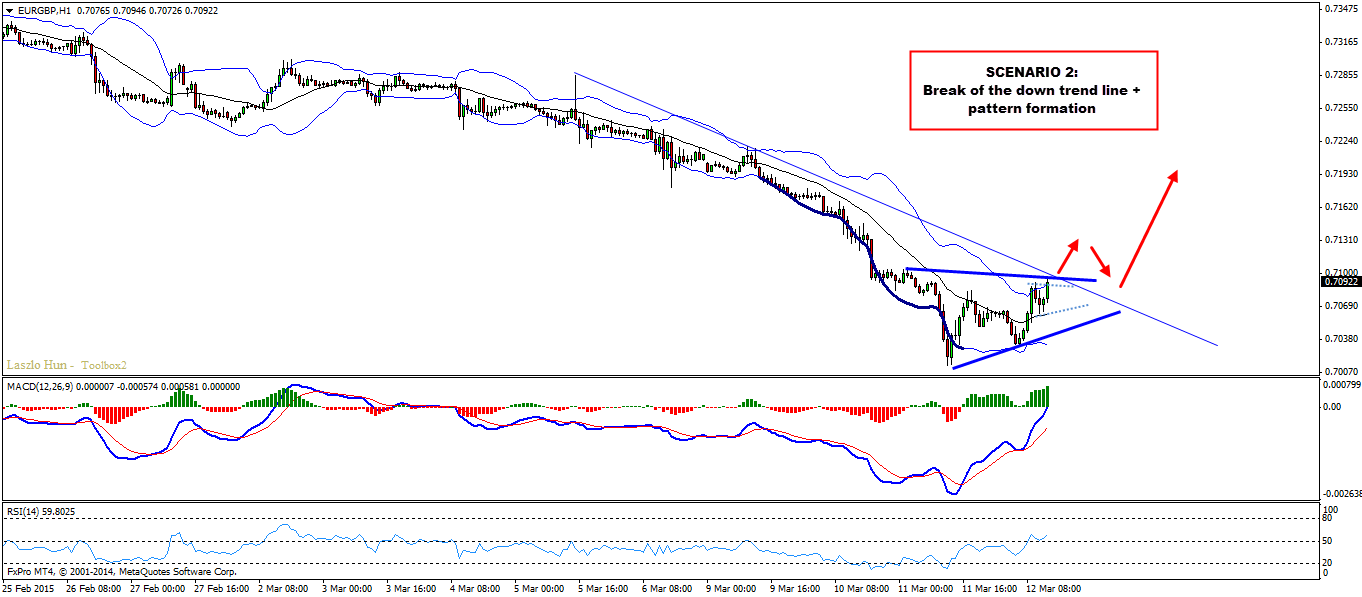
Scenario 2
H1 – look for break of the down trend line as shown on the second screenshot above. It is possible that the pair will get inside a range and form some kind of continuation pattern such as flag or triangle. So once broken above together with the down trend line we will look for a buy trigger.
Target 1: D1 20 MA
Target 2: Opposite Bollinger Band on D1
Stop Loss Scenario 1: below last low created
Stop Loss Scenario 2: below the broken down trend line and most recent support
Video Explanation
Yours
Vladimir
GDP growth is one of the most important indicators of economic health. But does stronger…
When it comes to fundamental Forex analysis, few institutions matter as much as the Federal…
Interest rates are one of the most important fundamental forces in the Forex market. But…
The latest U.S. employment report has delivered a significant warning for the market. With only…
The Forex market does not always offer clear trading opportunities. Sometimes, price moves sharply in…
Open social media for a few minutes and you can easily find someone talking about…