Hi Traders! EURJPY forecast follow up and update is here. On September 16th I shared this Technical Analysis – EURJPY Forecast post in my blog. In this post, let’s do a recap of this setup and see how it has developed now. If you would like to learn more about the way we trade and the technical analysis we use then check out the Traders Academy Club. Spoiler alert – free memberships are available!
Missed this trade?
Never miss a trade opportunity again! Join the Traders Academy Club
Now let’s summarize the idea first:
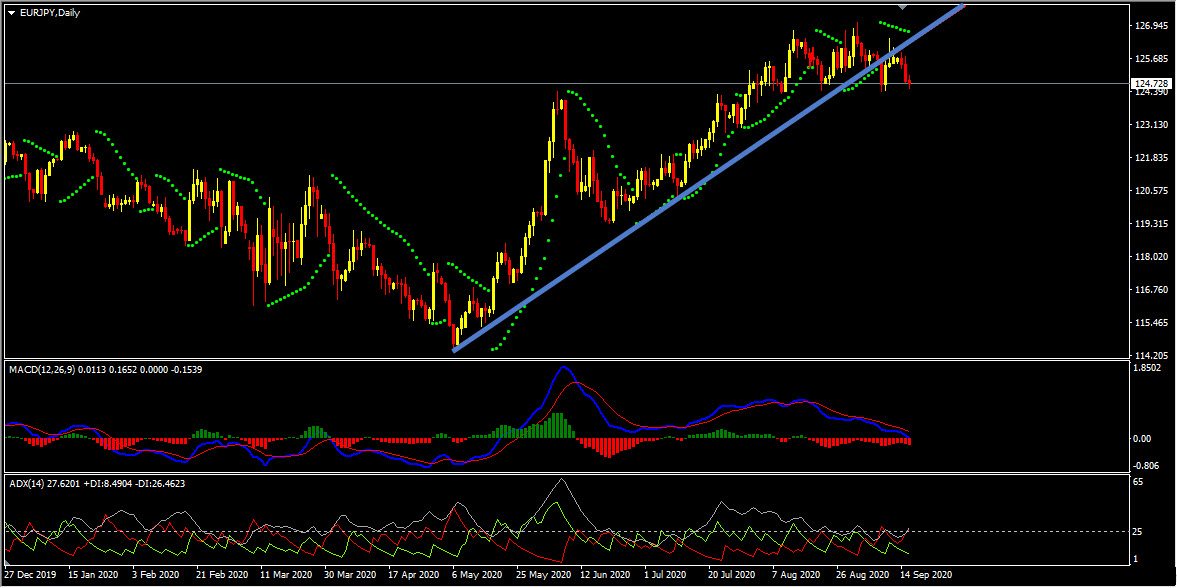
On the daily chart, we had a bearish divergence and the price which was moving lower has broken below the uptrend line. And, based on the Parabolic Sar the dots are above the price, we may consider these as evidences of bearish pressure. In addition to this, the ADX indicator gave a bearish signal at the cross of -DI (red line) versus +DI (green line), and the main signal line (silver line) reads value over 25, we may consider this as yet another evidence of bearish pressure.
(Note: You can learn about a Killer Forex Strategy “Double Trend Line Principle” here)
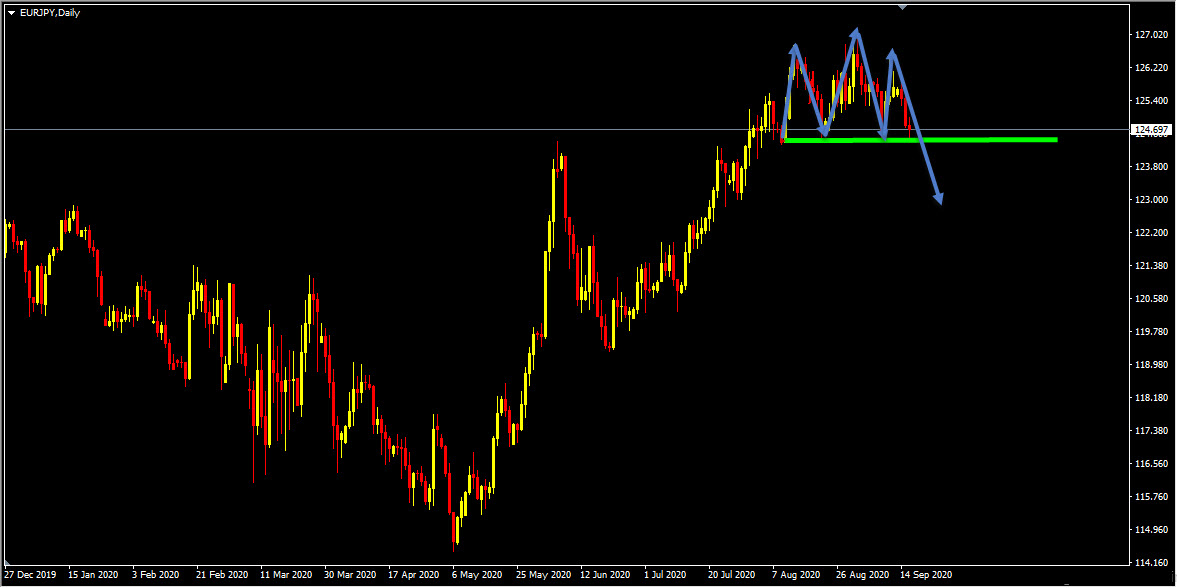
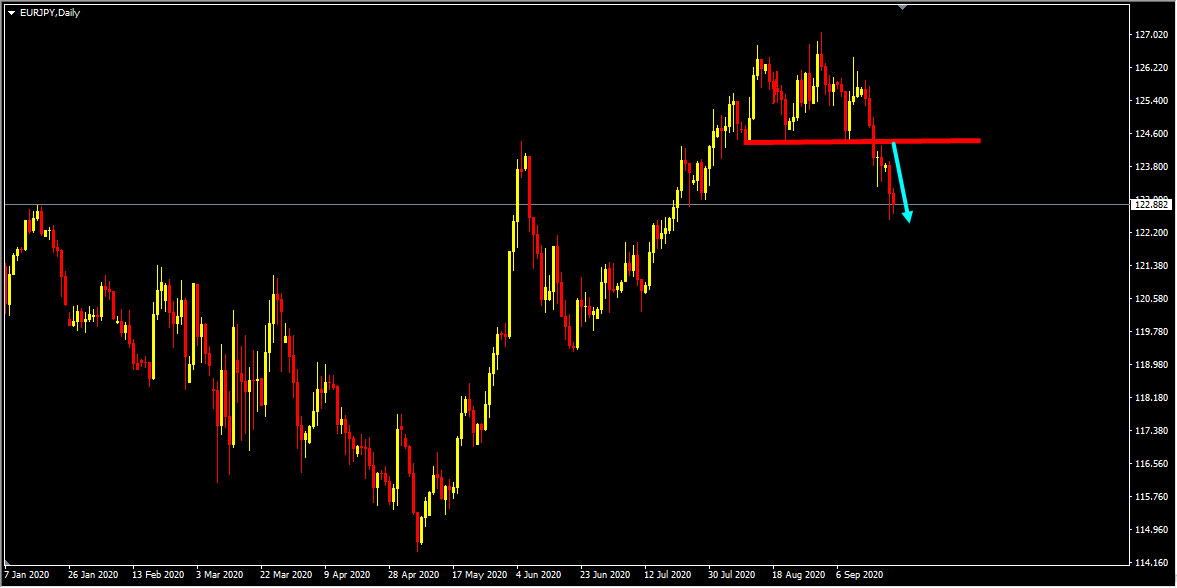
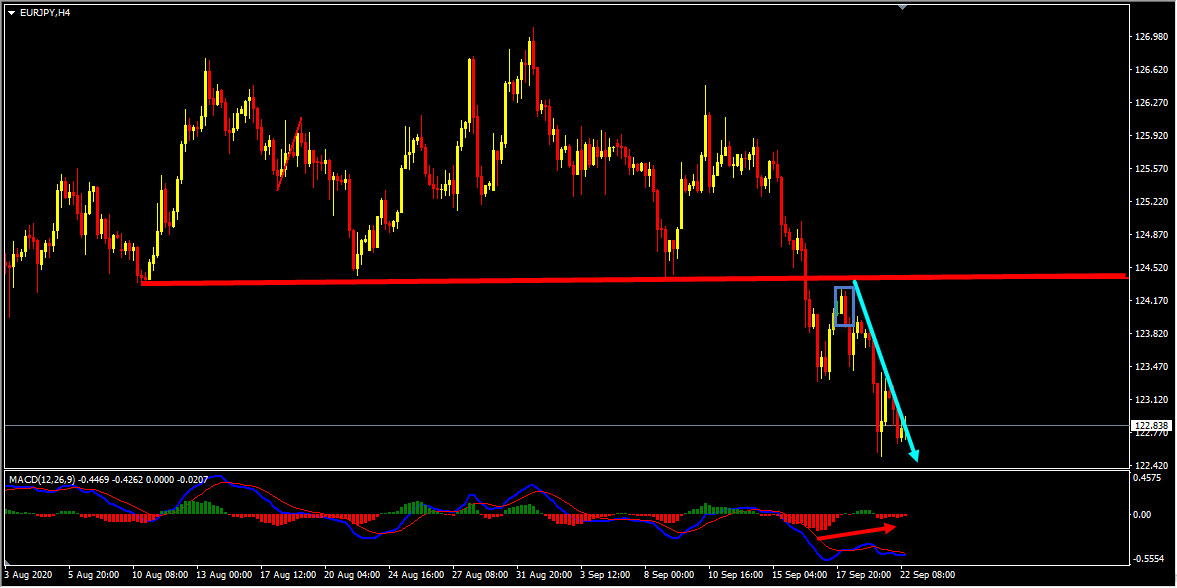
So based on the above-mentioned analysis, my view was bearish here and I was expecting the price to continue lower further after the head and shoulders pattern neckline breakout. The price action followed my analysis, it broke below the neckline, and then it moved further lower exactly as I expected it to, delivering 180+ pips move so far.
Note: If you want to learn about Money Management you can find it here
As traders we always have two choices, the first one is to fall in love with our analysis and try to convince the market and expect the price to move in the direction as per our wish. The second one is to follow the facts that the market provides us and make the right actions according to that. As you know the first option won’t help us and as you can see in the example above what happened when we followed the facts that the market hinted us and took the right action according to that.
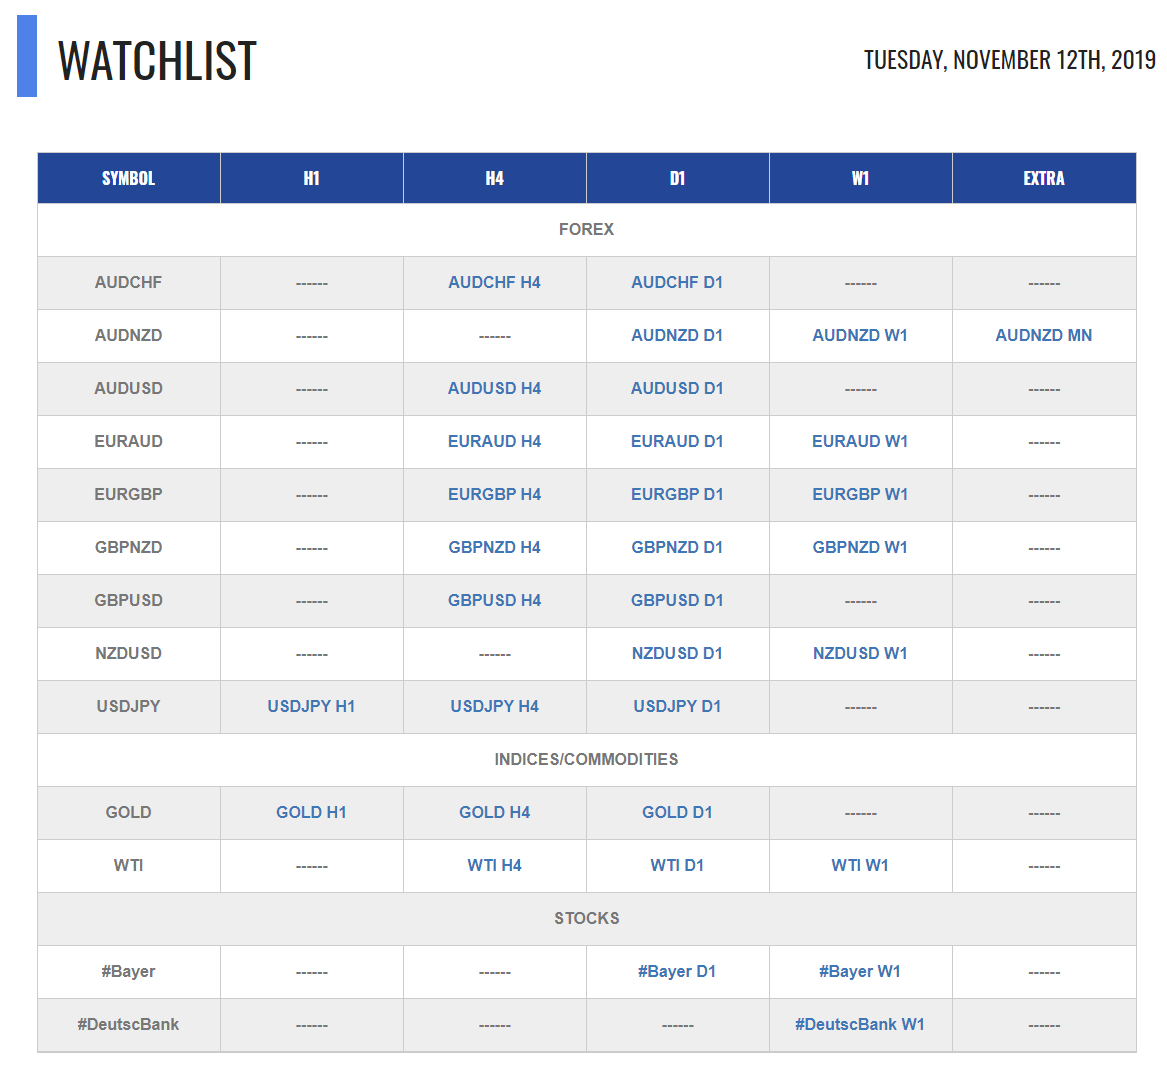
For similar trade ideas and much more join the Traders Academy Club and get access to our complete watch list and trade report.
This is how the report looks like. A table with the hottest market opportunities, screenshot behind every pair and time frame (anything that is in blue inside the table is clickable and leads to a screenshot) + a summary in text format, kind of highlights. And of course, Live Market Analysis every single day.
If you have any further questions, don’t hesitate to drop a comment below!
To your success,
Vladimir Ribakov
Certified Financial Technician
GDP growth is one of the most important indicators of economic health. But does stronger…
When it comes to fundamental Forex analysis, few institutions matter as much as the Federal…
Interest rates are one of the most important fundamental forces in the Forex market. But…
The latest U.S. employment report has delivered a significant warning for the market. With only…
The Forex market does not always offer clear trading opportunities. Sometimes, price moves sharply in…
Open social media for a few minutes and you can easily find someone talking about…