Hi Traders! Oil short term forecast follow up and update is here. On June 30th I shared this “Oil Technical Analysis And Short Term Forecast” post in our blog. In this post, let’s do a recap of this setup and see how it has developed now. If you would like to learn more about the way we trade and the technical analysis we use then check out the Traders Academy Club. Spoiler alert – free memberships are available!
My Idea
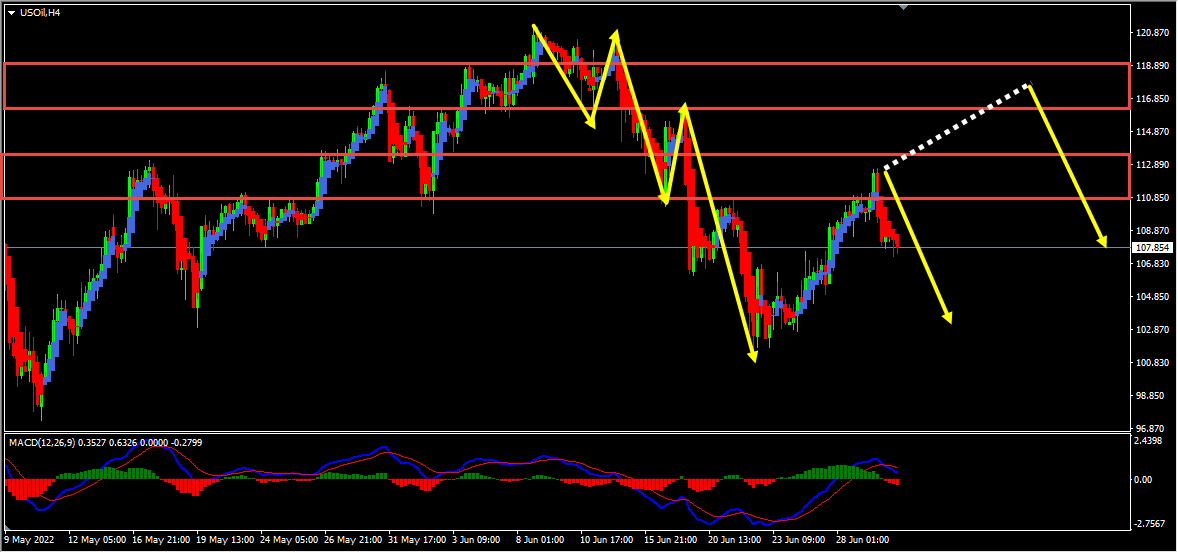
On the H4 chart, based on the Heikin Ashi candles we can see that currently, we have strong bearish bodies in downward moving market conditions so it basically reflects a bearish environment. In addition to this, the price which is moving lower has created a bearish trend pattern in the form of three lower highs, lower lows which we may consider as evidence of bearish pressure. Generally, after a bearish trend pattern, we may expect corrections and then further continuation lower. Currently it looks like a correction is happening. Also, we had two strong support zones that has formed and the price which is moving lower has broken below these zones and is holding below them, we may consider this as yet another evidence of bearish pressure. Currently, these strong support zones are acting as strong resistance zones for us. Until these two strong resistance zones (marked in red) shown in the image below hold my short term view remains bearish here and I expect the price to move lower further.
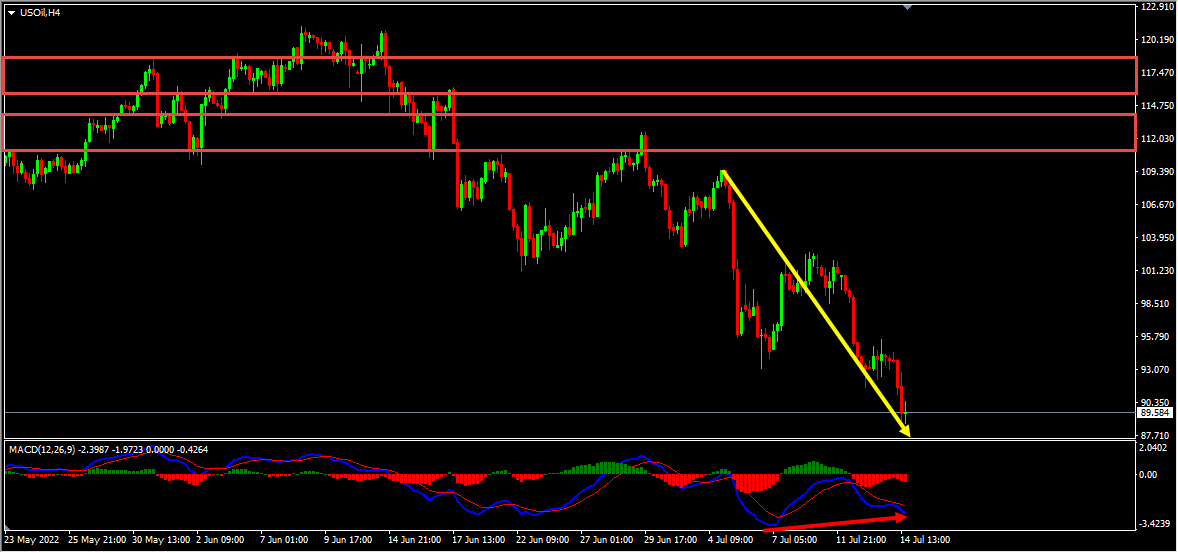
Based on the above-mentioned analysis, on the H4 chart, my view was bearish here and I was expecting the price to move lower further until the strong resistance zones hold. The price action followed my analysis exactly as I expected it to here. After the bearish trend pattern the pullback that I was looking for happened with the price reaching the first strong resistance zone, respected it and moved lower from this zone. The price then moved lower further delivering an amazing move to downside so far!
Currently, we have a potential bullish divergence in play on the H4 chart, this is something that we definitely need to pay attention to as it is an opposite evidence. So if you are still involved in the sells then this is a very important place to consider and manage your trade (cash out or partial cash out or trailing protections or partial hedge, etc.. depending on the strategy that you work with). When you find an opposite evidence you should always consider managing your position.
Note: If you want to learn about Money Management you can find it here
For similar trade ideas and much more I invite you to
Also, you can get one of our strategies free of charge. You will find all the details here
If you have any further questions, don’t hesitate to drop a comment below!
Happy Trading!
Arvinth Akash
Traders Academy Club Team
Have you ever opened your trading platform, watched the market move, and felt that you…
Employment data is one of the most important economic indicators in Forex fundamental analysis. It…
Welcome back to our weekly Forex forecast at Home Trader Club. This week, we are…
GDP growth is one of the most important indicators of economic health. But does stronger…
When it comes to fundamental Forex analysis, few institutions matter as much as the Federal…
Interest rates are one of the most important fundamental forces in the Forex market. But…