Hi Traders! SP500 forecast follow up and update is here. On April 30th I shared this “SP500 Forecast” in Trading View. In this post, lets do a recap of this setup and see how it has developed now. If you would like to learn more about the way we trade and the technical analysis we use then check out the Traders Academy Club. Spoiler alert – free memberships are available!
Missed this trade?
Never miss a trade opportunity again! Join the Traders Academy Club
Now, let’s summarize the idea first:
My idea was as follows:
D1 – We have a bearish hidden divergence followed by a potential continuing divergence.
H4 – Bollinger Bands 20 candles ride, bearish divergence.
We have a key resistance zone that has formed by the fibonacci expansion levels of the cycles we have.
Until this key resistance zone shown in the chart holds, we may expect short term retraces.
On the H4 chart the price moved exactly as per my plan, it respected the key resistance zone as expected and it moved lower.
Based on the current scenario we have the first leg down and it looks like a correction is happening. The price still has room lower towards the 38.2% (2661.25) – 50% (2567.50) fibonacci retracement zones of the bullish trend pattern. So my short term view still remains bearish here.
(Note: You can follow me here on Trading View and also on my blog to get similar ideas on a daily basis)
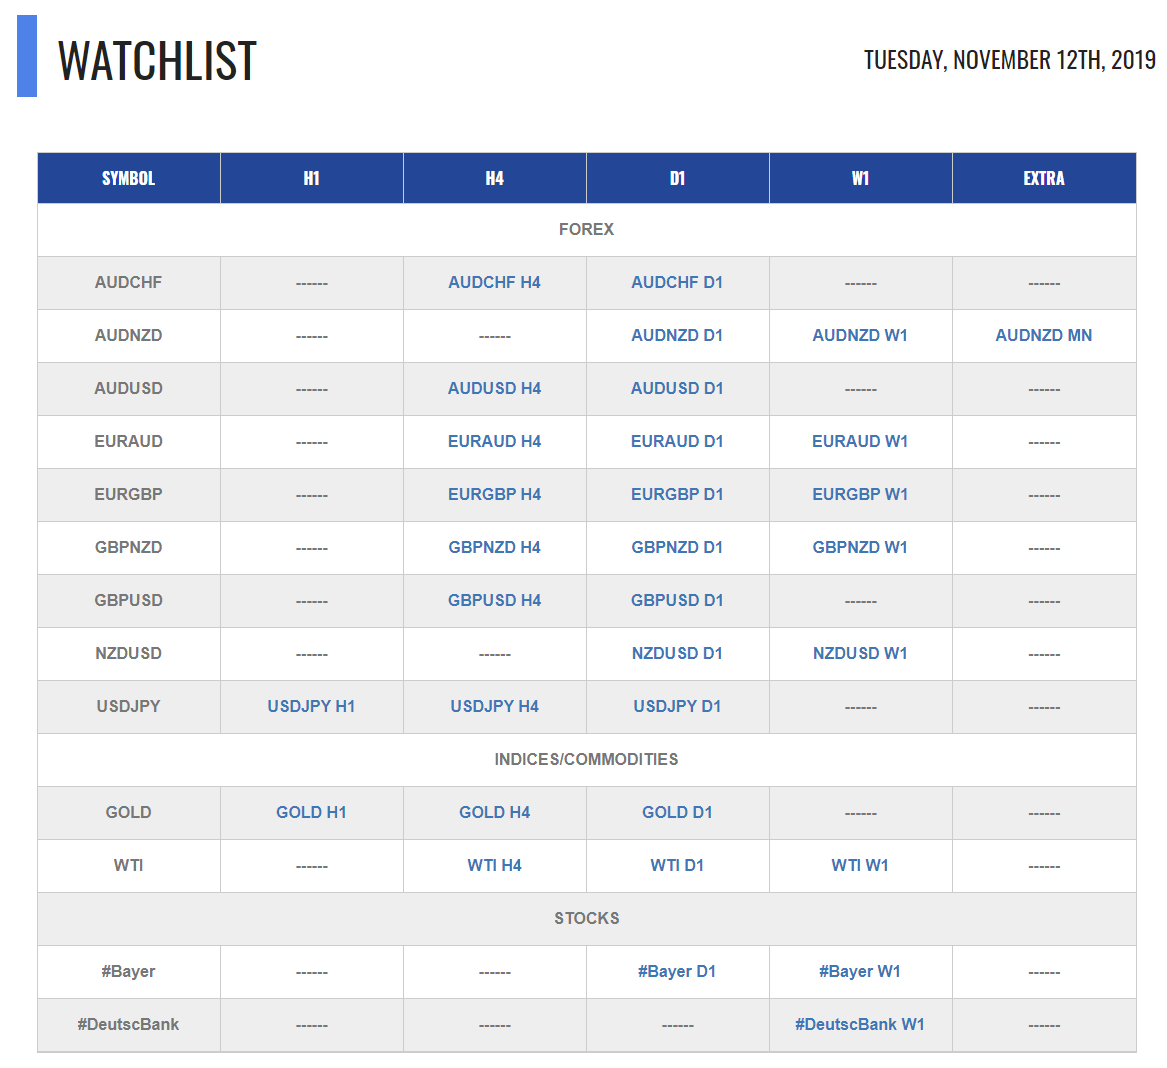
For similar trade ideas and much more join the Traders Academy Club and get access to our complete watch list and trade report.
This is how the report looks like. A table with the hottest market opportunities, screenshot behind every pair and time frame (anything that is in blue inside the table is clickable and leads to a screenshot) + a summary in text format, kind of highlights. And of course Live Trading Room every single day.
If you have any further questions, don’t hesitate to drop a comment below!
To your success,
Vladimir Ribakov
Certified Financial Technician
When traders study the Forex market, they often focus on economic indicators such as inflation,…
The markets are showing some fascinating technical developments this week, and there are several opportunities…
When Being Right Becomes More Important Than Making Money Every Forex trader wants to make…
Why Doesn't a Strong Economy Always Have a Strong Currency? Imagine that a country reports…
Have you ever opened your trading platform, watched the market move, and felt that you…
Employment data is one of the most important economic indicators in Forex fundamental analysis. It…