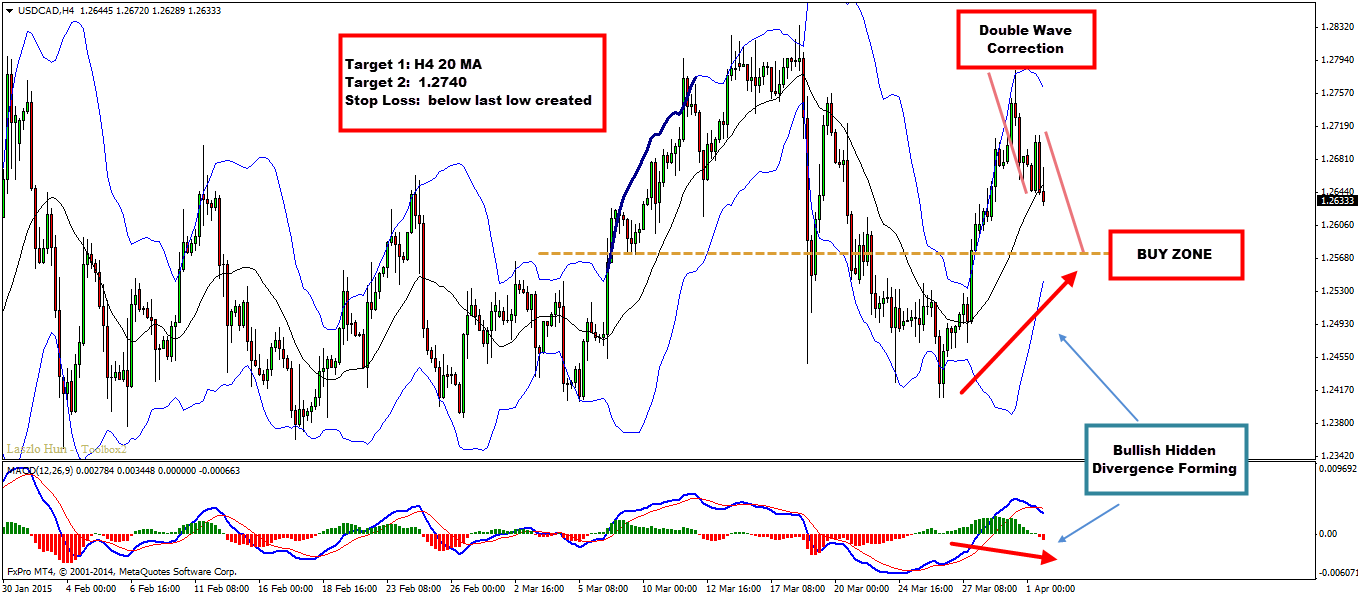
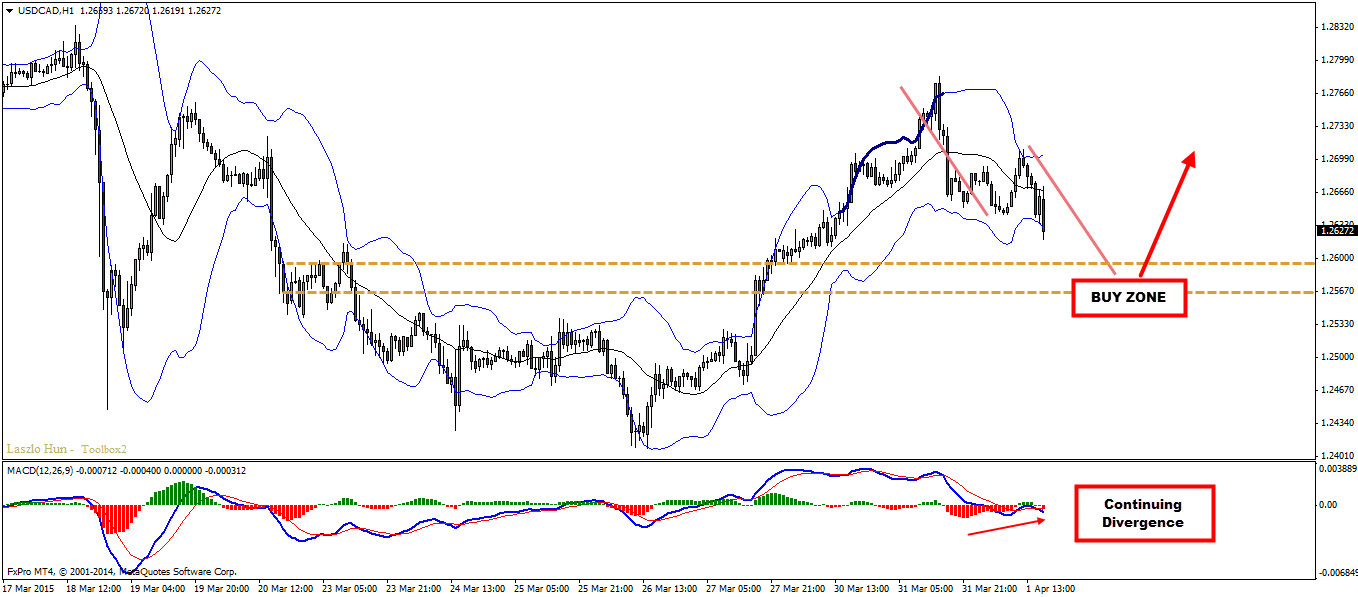
I’ve been following this pair since last week but the market never did what it was expected to, for the sell scenario to kick in. Now I think we can switch to bullish view and look to buy once the double wave correction completes itself. It is well seen on the H4 chart and the H1 chart. Bullish hidden divergence is also forming at the moment. Here is the plan on how to join.
Technical Overview:
H4 – potential double wave correction, bullish hidden divergence
H1
Entry:
H4 – we are following the double wave correction as seen in the screenshot. there is also bullish hidden divergence forming on the H4 chart and bullish divergence is spotted on the H1 chart as well. Once the pair reaches the levels we want it to, we can go ahead and attack with a buy
Target 1: H4 20 MA
Target 2: 1.2740
Stop Loss: below last low created
Video Explanation:
GDP growth is one of the most important indicators of economic health. But does stronger…
When it comes to fundamental Forex analysis, few institutions matter as much as the Federal…
Interest rates are one of the most important fundamental forces in the Forex market. But…
The latest U.S. employment report has delivered a significant warning for the market. With only…
The Forex market does not always offer clear trading opportunities. Sometimes, price moves sharply in…
Open social media for a few minutes and you can easily find someone talking about…