Hi Traders! GBPCHF forecast and technical analysis is here. The way I would like to analyze the chart for setups is based on multi-timeframe confirmations because in my POV if we get more evidences on different timeframes for the same direction then it makes the setup much more reliable. If you would like to learn more about the way we trade and the technical analysis we use then check out the Traders Academy Club Spoiler alert – free memberships are available! Let’s start our analysis from the highest timeframe which will be the daily chart here.
You can watch the video explanation of this idea here
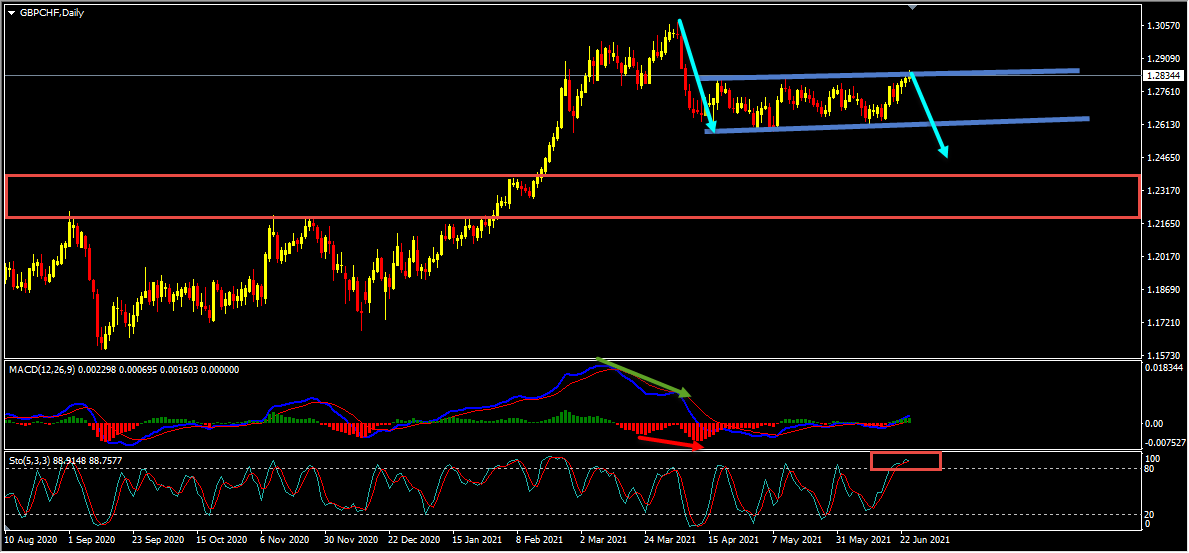
On the daily chart the price which is moving higher has broken above a strong resistance zone and is holding above it. Currently it looks like a correction is happening. We also have a bearish divergence that has formed between the first high that has formed at 1.29877 and the second high that has formed at 1.30730 based on the MACD indicator. The price then moved lower and broke below the last low at 1.27775 thus forming a classical setup of bearish divergence followed by bearish convergence, we may consider this as evidence of bearish pressure. As per the book scenario after a bearish convergence we may expect corrections and then further continuation lower. Currently it looks like a flat correction is happening in the form of a range and the price has reached the top of this range. In addition to this, based on the Stochastic Oscillator we could see that the price has reached its extreme which we may consider as yet another evidence of bearish pressure. We may now move down to lower timeframe and look for evidences supporting this bearish view.
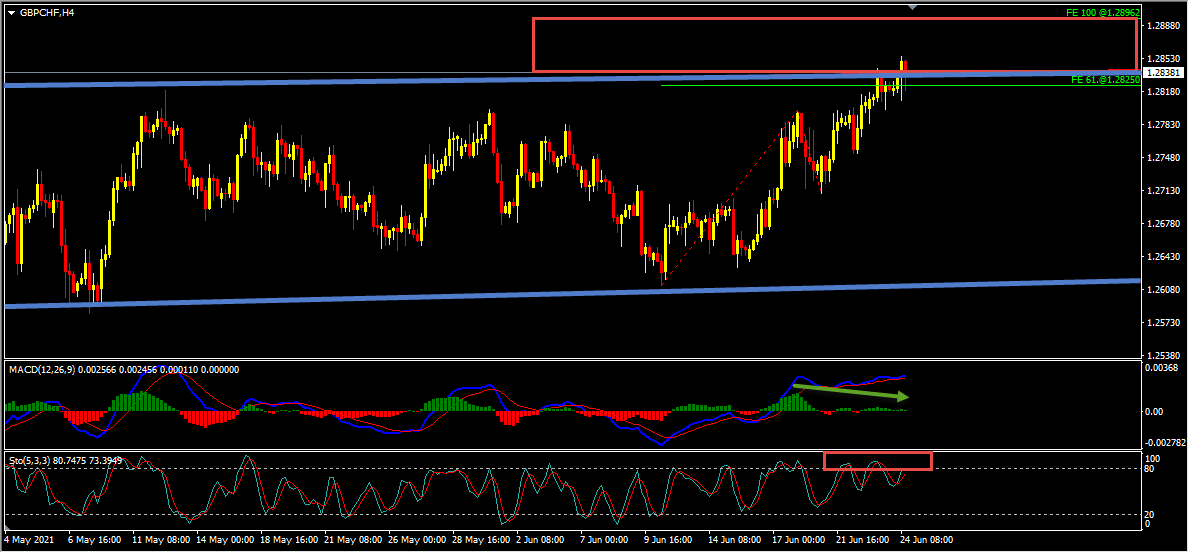
On the H4 chart, while measuring the first wave we have inside the daily range, we could see that the 100%(1.28962) Fibonacci expansion level coincides with the top of this range, thus making this area a key resistance zone for us. Also, we have a bearish divergence that has formed between the first high that has formed at 1.27980 and the second high that has formed at 1.28558 based on the MACD indicator which we may consider as evidence of bearish pressure. In addition to this, based on the Stochastic Oscillator we could see that the price has reached its extreme here as well which we may consider as yet another evidence of bearish pressure. So everything looks good here for the bears and we may now move down to one more timeframe lower and look for evidences supporting this bearish view.
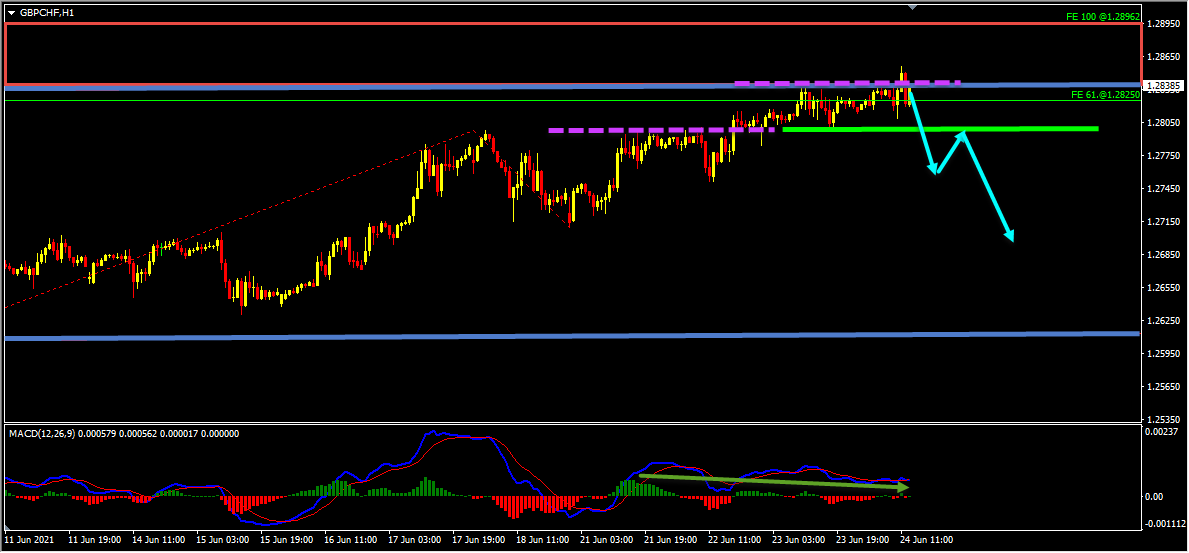
On the H1 chart, the price which is moving higher has created multiple false breaks with a bearish divergence between the first high that has formed at 1.27985 and the second high that has formed at 1.28558 based on the MACD indicator which we may consider as evidences of bearish pressure. If the price moves lower and if we get a valid breakout below the low at 1.28000 we may then consider it as a validation for the bearish view and may expect the price to continue lower further. Alternatively if the price moves higher and if we get a valid breakout above the H4 key resistance zone then this bearish view will be invalidated.
GBPCHF D1(Daily) Chart Analysis
GBPCHF H4(4 Hours) Chart Analysis
GBPCHF H1(1 Hour) Chary Analysis
It is always recommended to look for confirmations before you jump into any trade. If you are not sure about how to trade this sell setup then you can use any setup and strategy that you have in your arsenal to look for bearish moves and join this sell trade.
Also, don’t forget to protect your sell trade using a stop loss and make sure to set a target and keep a proper risk/reward ratio.
You will also find a pretty extensive database of educational materials here in the blog – just use the search or check out the Forex Education section above.
Not sure how to enter a trade? Spot reversals (bounces)? Not sure how to spot breakouts?
I invite you to join us in our live market analysis, on daily basis, and improve your trading with us.
Also, you can get one of our strategies free of charge. You will find all the details here
If you have any further questions, don’t hesitate to drop a comment below!
To your success,
Vladimir Ribakov
Certified Financial Technician
Hi Traders! Ethereum short term forecast follow-up and update is here. On May 26th, 2026…
Hi Traders! GBPAUD short term forecast and technical analysis is here. We do our analysis…
Hi Traders! USDCHF short term forecast update and follow up is here. On May 20th,…
Hi Traders! CADCHF short term forecast and technical analysis is here. We do our analysis…
The dollar was broadly steady on Monday as cautious investors watched out for signals on…
Hi Traders! Arvinth here from the Home Trader Club team. The weekly summary and, review of July…