Hi Traders! USDJPY short term forecast follow-up and update is here. On March 29th 2023 I shared this “USDJPY Short Term Forecast And Technical Analysis” post in our blog. In this post, let’s do a recap of this setup and see how it has developed now. If you would like to learn more about the way we trade and the technical analysis we use, then check out the Home Trader Club. Spoiler alert – free memberships are available!
My Idea
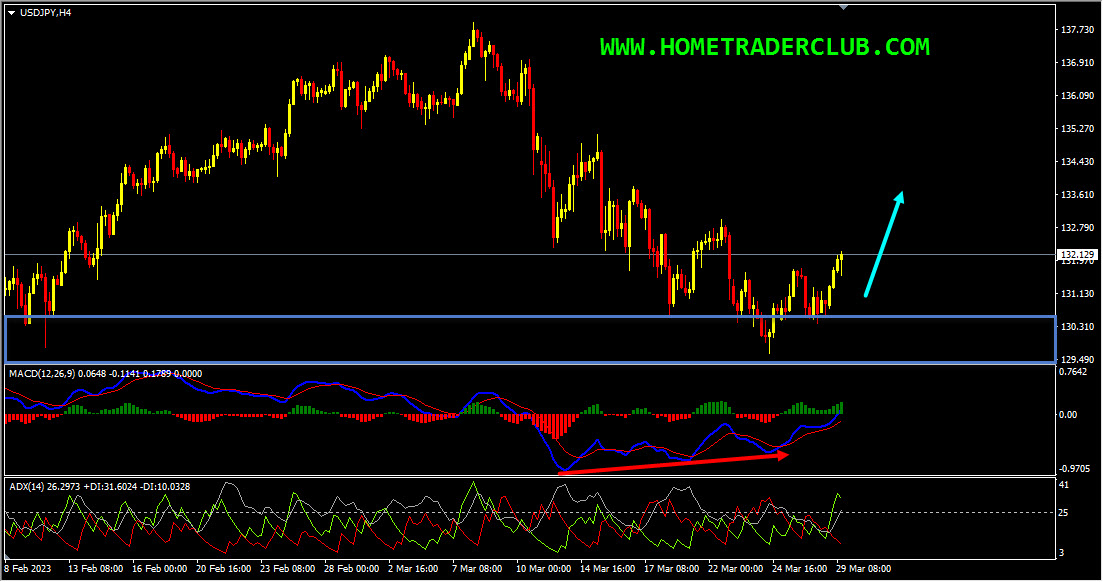
Looking at the H4 chart, we could see that the price which was moving lower has created a bullish divergence that has formed between the first low that has formed at 132.282 and the second low that has formed at 129.640 based on the MACD indicator which we may consider as evidence of bullish pressure. In addition to this, the ADX indicator gave a bullish signal here at the cross of +DI (green line) versus -DI (red line) and the main signal line (silver line) reads value over 25, we may consider this as yet another evidence of bullish pressure. Also, currently, there are no signs opposing this short term bullish view here as well. So based on all this, until the strong support zone (marked in blue) shown in the image below holds my short-term view remains bullish here and I expect the price to move higher further.
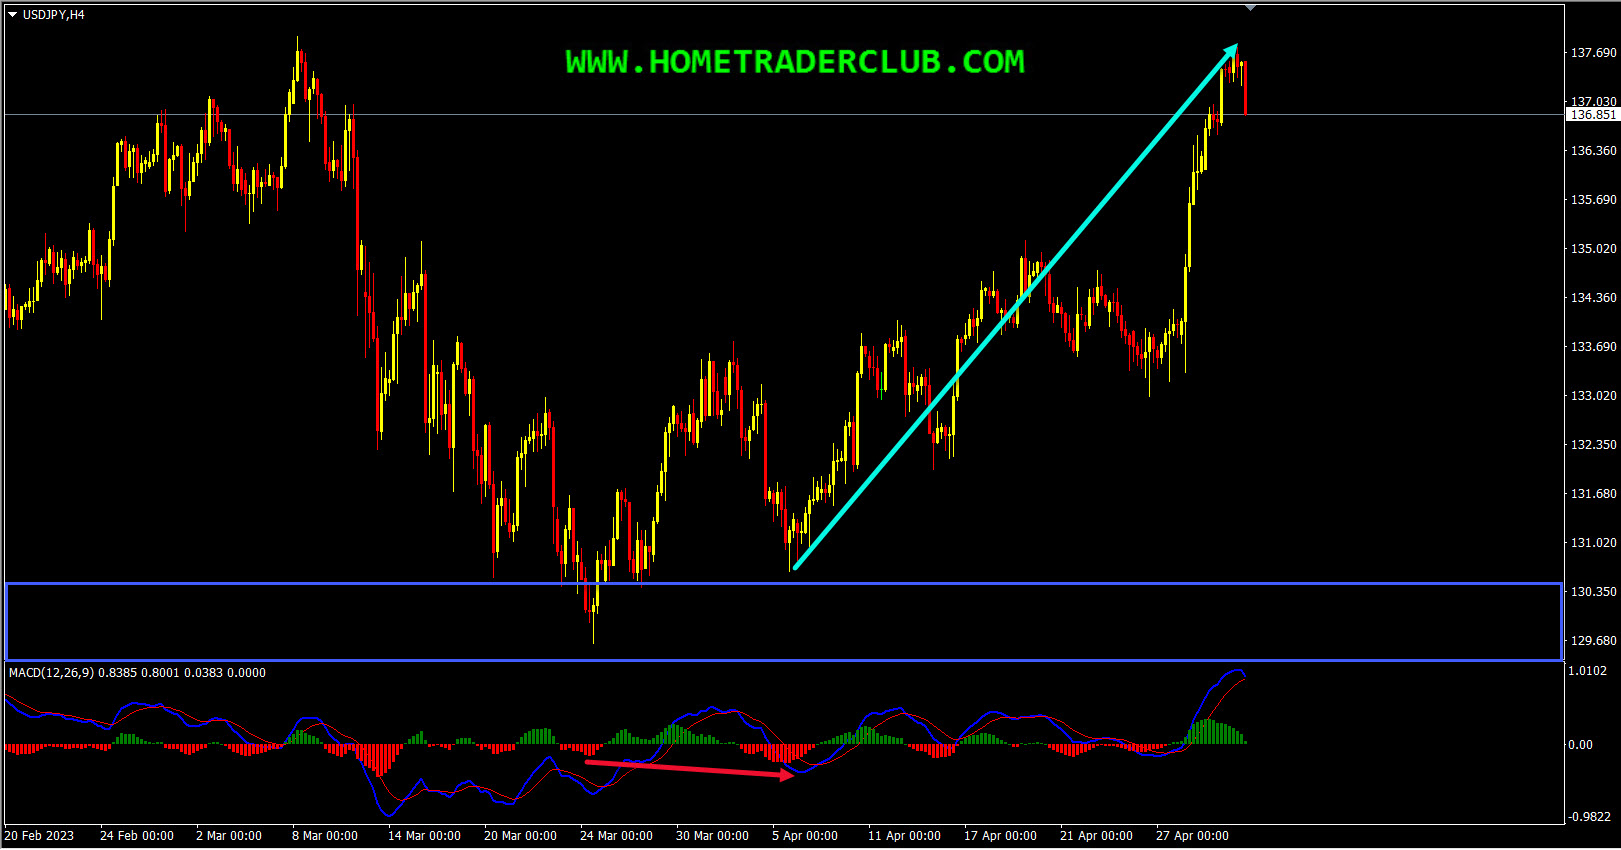
Based on the above-mentioned analysis, my short-term view was bullish here, and I was expecting the price to move higher further until the strong support zone holds. The price action followed my analysis here exactly as I expected it to. On the H4 chart, we had a pullback with the price creating a bullish hidden divergence between the first low formed at 129.640 and the second low formed at 130.626 based on the MACD indicator, which we may consider as a fact provided by the market supporting the bullish view. Most importantly, the price was holding above the strong support zone, and also, there were no signs opposing this short-term bullish view. The price then moved higher further and delivered 700+ pips move to the upside!
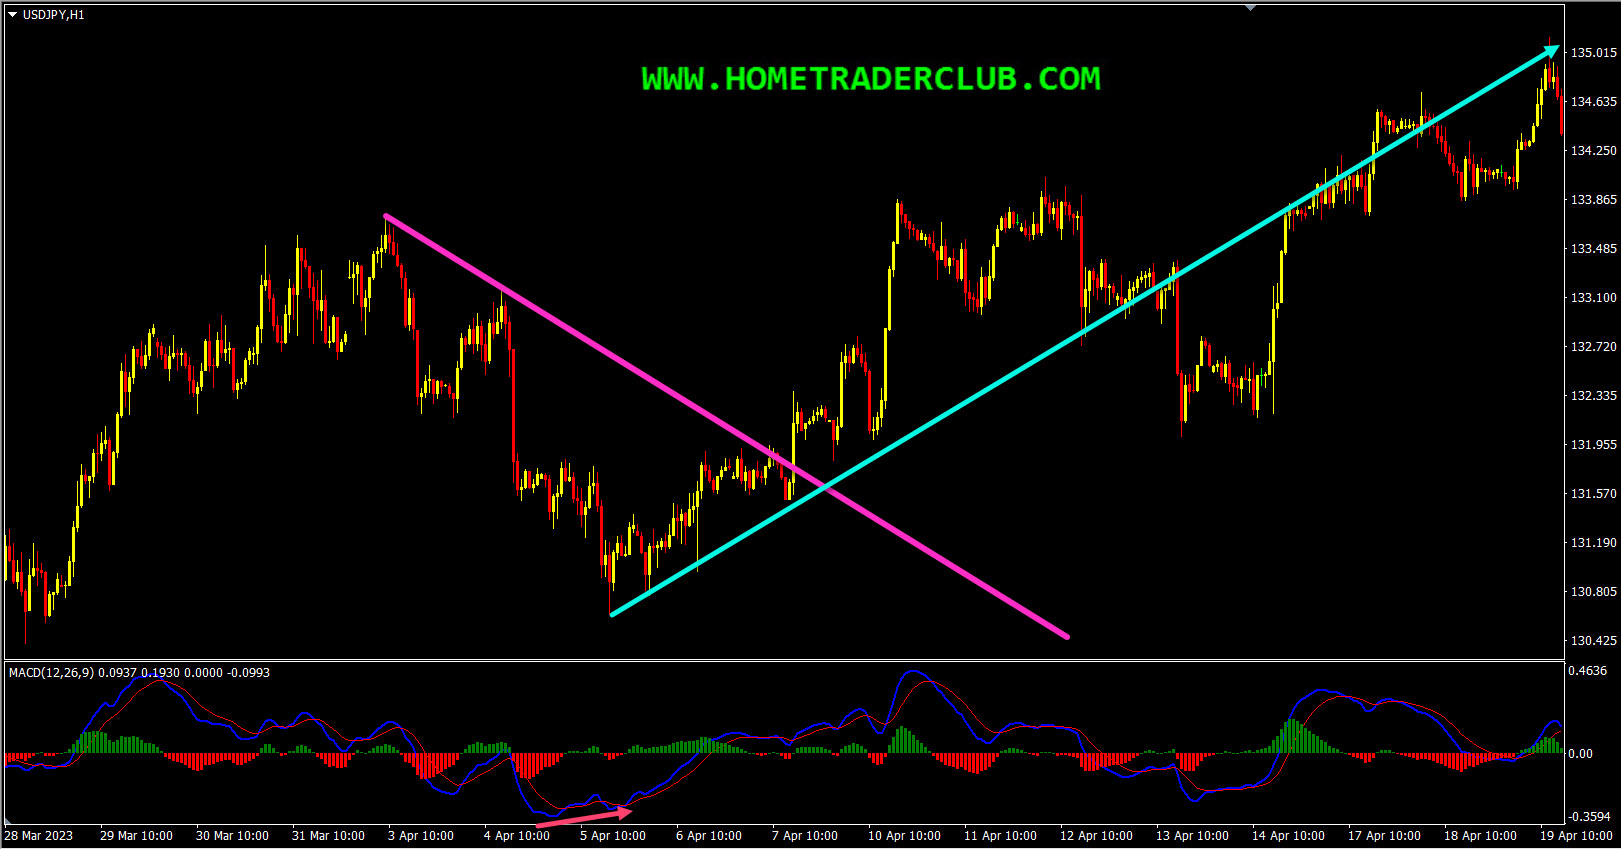
On the H1 chart, the market provided us with various facts supporting the bullish view. The price, which was moving lower, created a bullish divergence between the first low, which formed at 131.519 and the second low, which formed at 130.626, based on the MACD indicator. The price then moved higher and broke above the most recent downtrend line; we may consider these as facts provided by the market supporting the bullish view. Then as you can see in the image below, how the price moved higher after that and provided an excellent move to the upside!
As traders, we always have two choices, the first one is to fall in love with our analysis and try to convince the market and expect the price to move in the direction as per our wish. The second one is to follow the facts that the market provides us and make the right actions according to that. As you know the first option won’t help us and as you can see in the example above what happened when we followed the facts that the market hinted to us and took the right action according to that.
For similar trade ideas and much more I invite you to
Also, you can get one of our strategies free of charge. You will find all the details here
Download our best forex indicators here
If you have any further questions, don’t hesitate to drop a comment below!
Happy Trading!
Arvinth Akash
Home Trader Club Team.
Hi Traders! USDCHF short term forecast update and follow up is here. On May 20th,…
Hi Traders! CADCHF short term forecast and technical analysis is here. We do our analysis…
The dollar was broadly steady on Monday as cautious investors watched out for signals on…
Hi Traders! Arvinth here from the Home Trader Club team. The weekly summary and, review of July…
European markets edged lower on Thursday following more overnight volatility in Asia’s tech-dominated indexes, while…
Hi Traders! EURGBP short term forecast and technical analysis is here. We do our analysis…