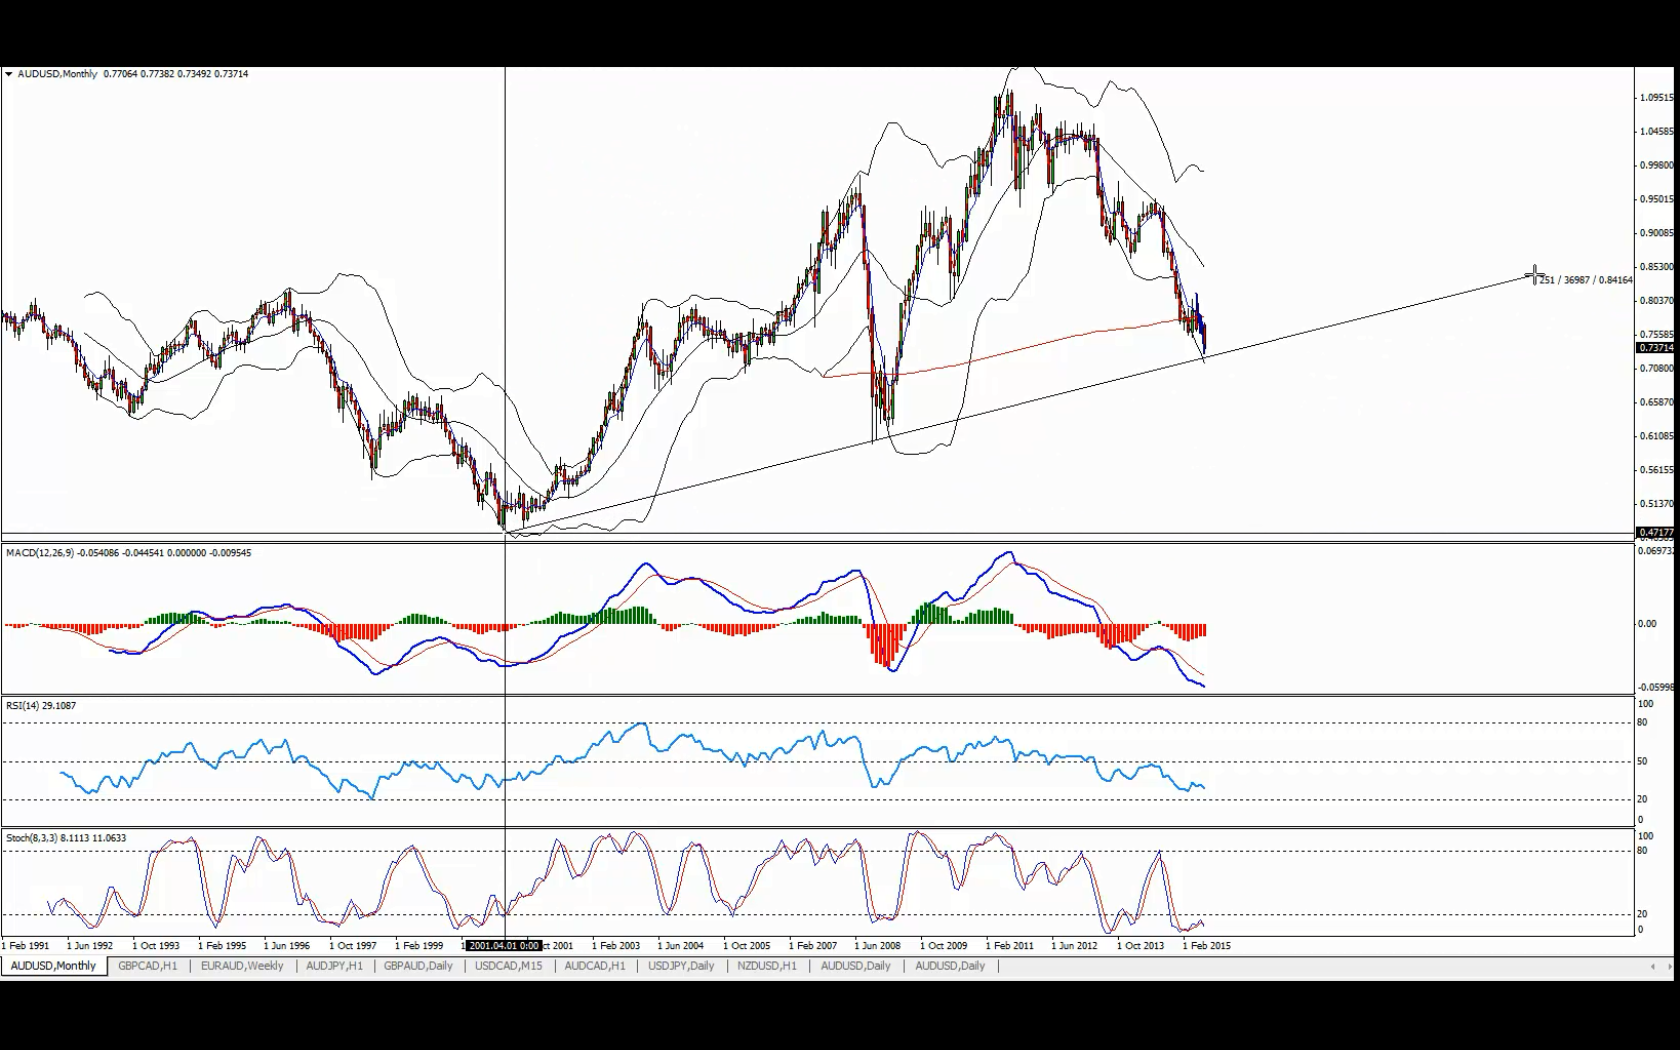
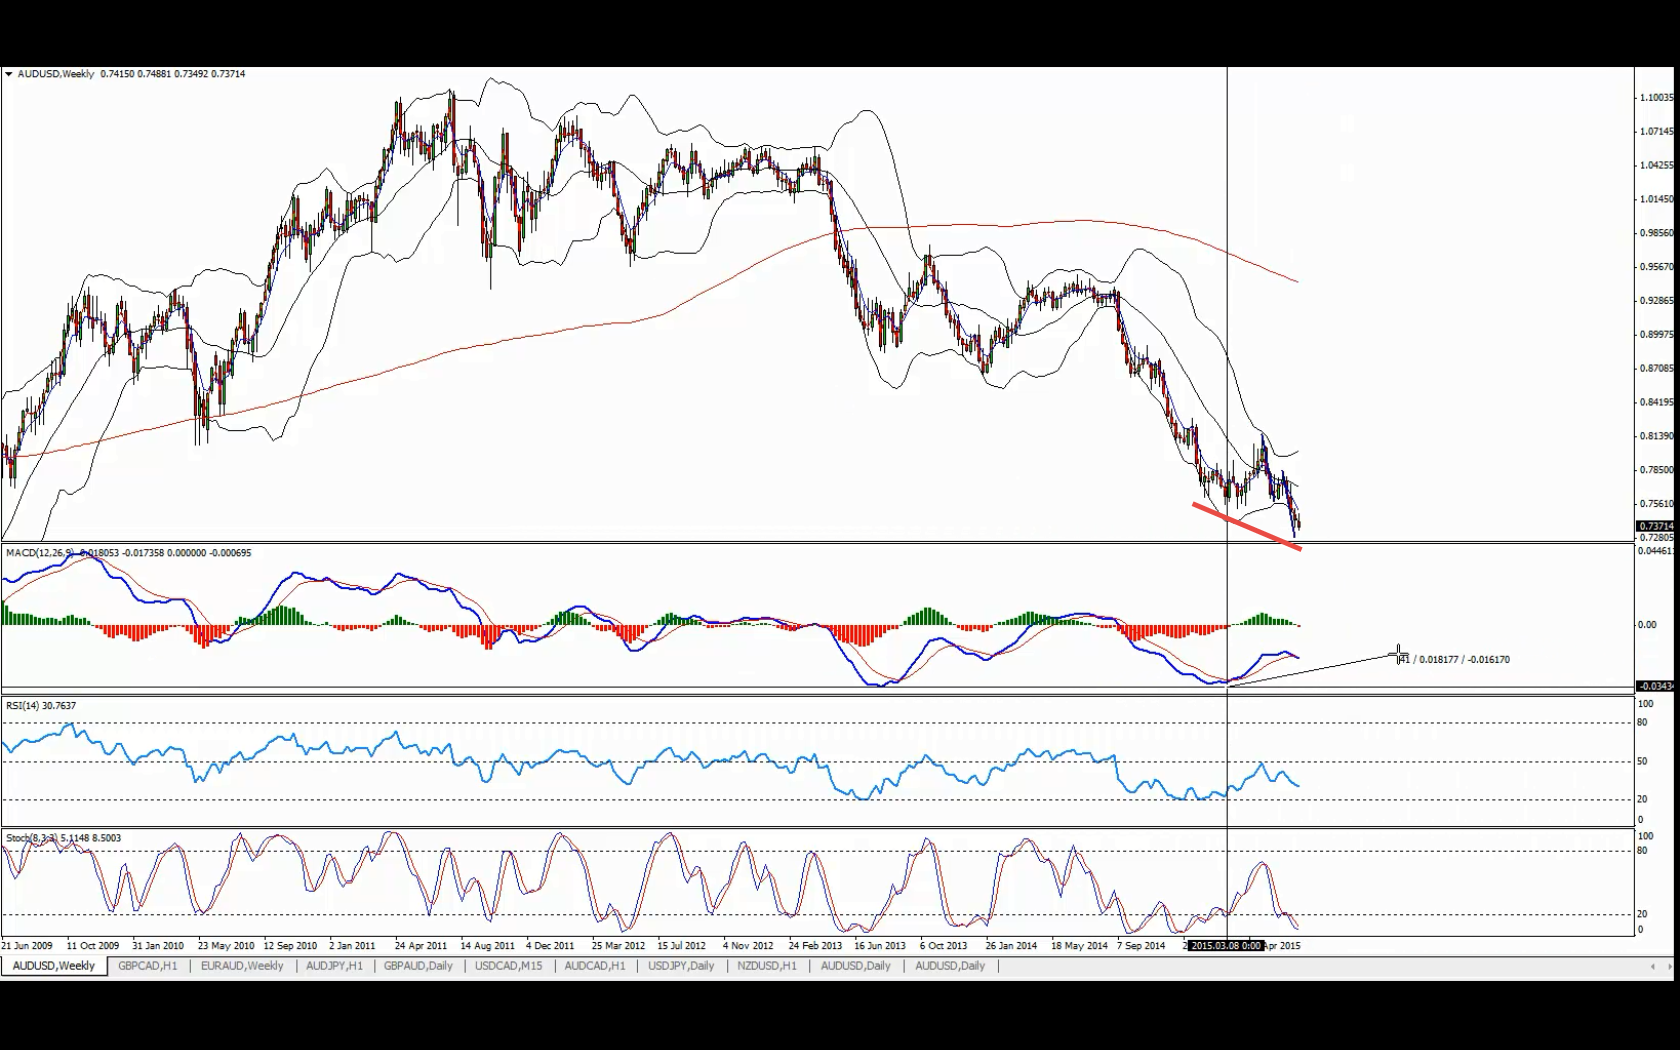
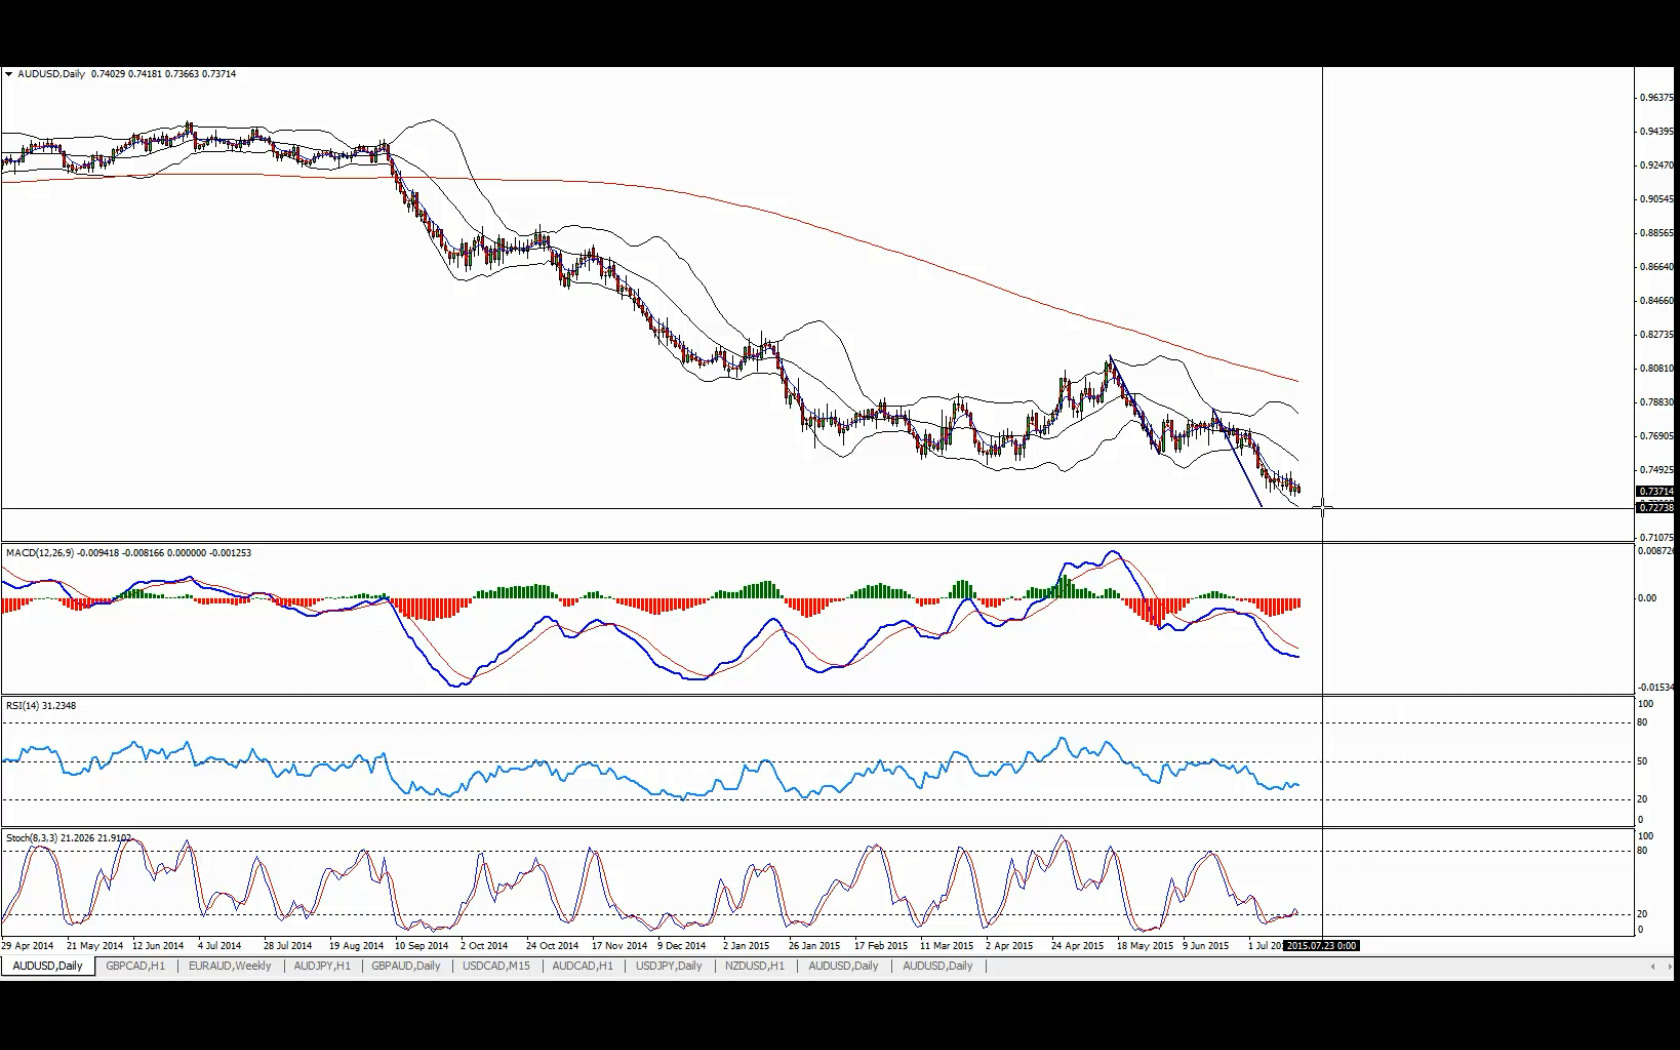
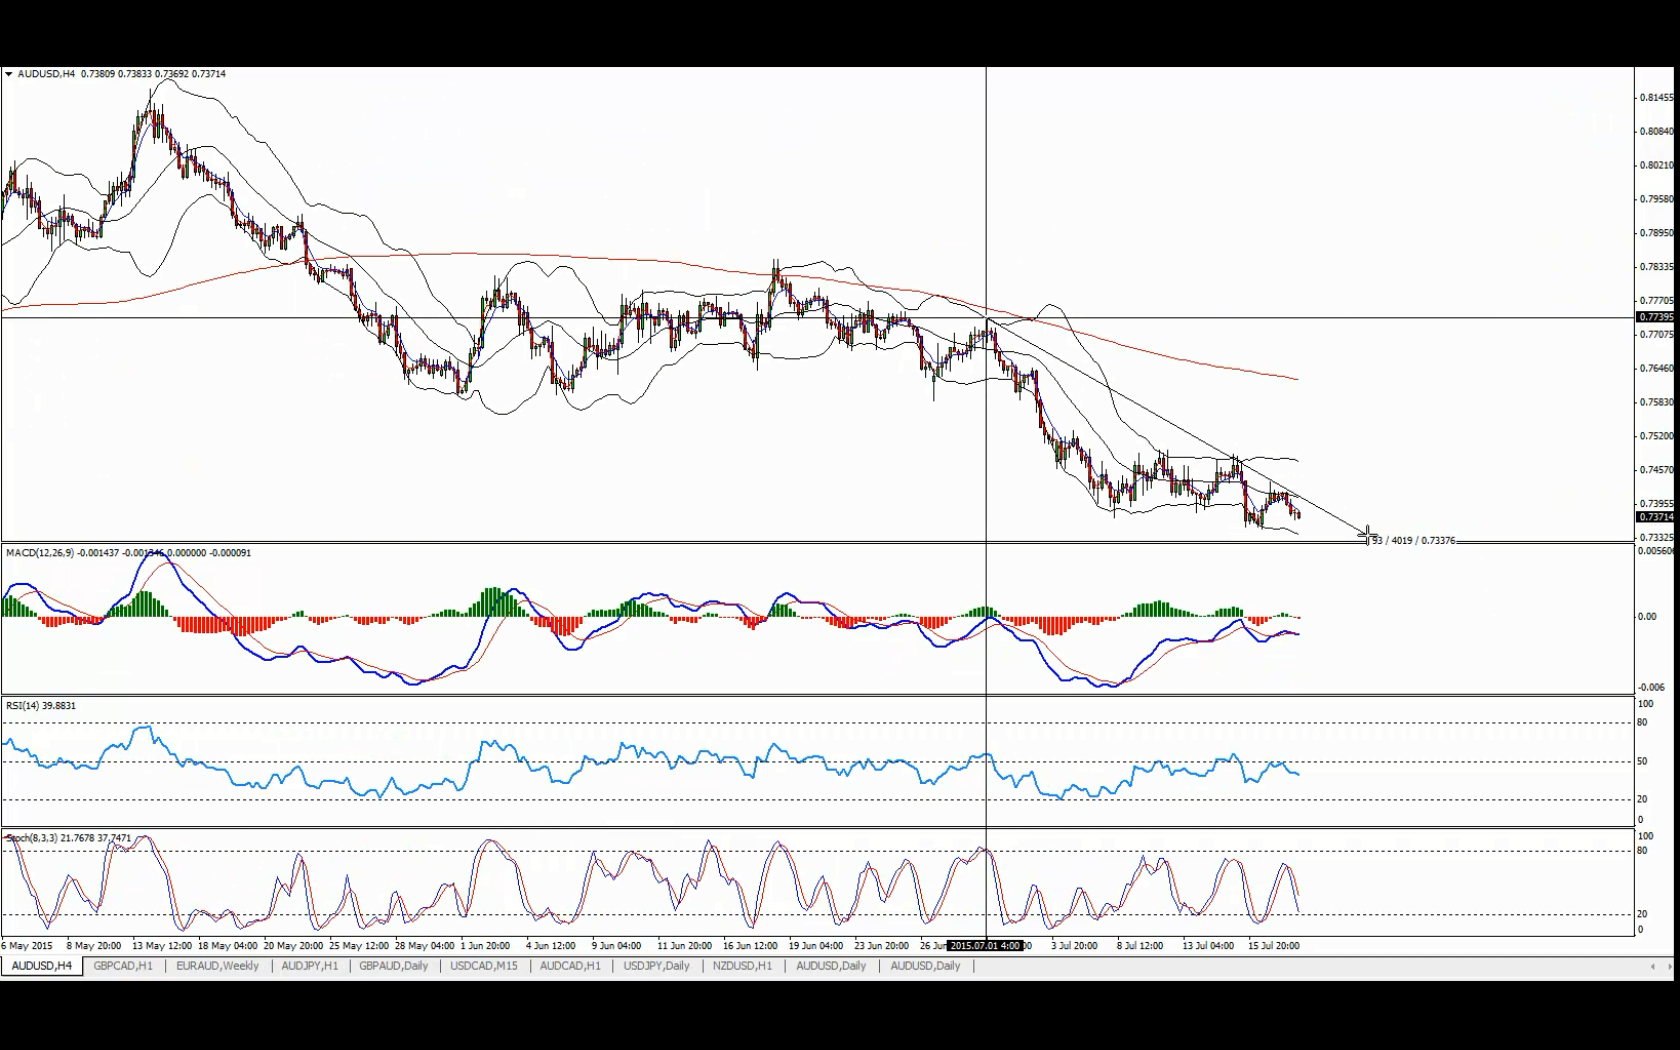
This pair looks fantastic in my opinion and soon there should be a great buy opportunity. All technical analysis point to the same conclusion – get ready to buy. There is a monthly bullish trend line waiting for the pair a bit lower, weekly chart shows signs of potential bullish divergence (we need to see a tick up on the histrogram to confirm it), daily chart has already formed bullish divergence and almost completed a double wave down (the cycle would be fully completed below 0.73) This is why i think once the right time comes we should be ready and have a plan for action. Ideally we want to see the pair a bit lower but the main idea here is to follow the four hour chart (h4) and its most recent down trend line. Once broken up along with the resistance zone we can look for buy opportunities.
Technical Analysis:
Monthly Chart (MN) – up trend line
Weekly Chart (W1) – potential bullish divergence
Daily Chart (D1) – bullish divergence, double wave down
Entry:
H4 – Wait for a break of the H4 down trend line and most recent resistance zone. Once the break happens we can look for buy opportunities.
Target 1 – 0.7510
Target 2 – 0.7630
Target 3 – 0.7730
Stop Loss – below last low created
Video Exaplanation:
GDP growth is one of the most important indicators of economic health. But does stronger…
When it comes to fundamental Forex analysis, few institutions matter as much as the Federal…
Interest rates are one of the most important fundamental forces in the Forex market. But…
The latest U.S. employment report has delivered a significant warning for the market. With only…
The Forex market does not always offer clear trading opportunities. Sometimes, price moves sharply in…
Open social media for a few minutes and you can easily find someone talking about…