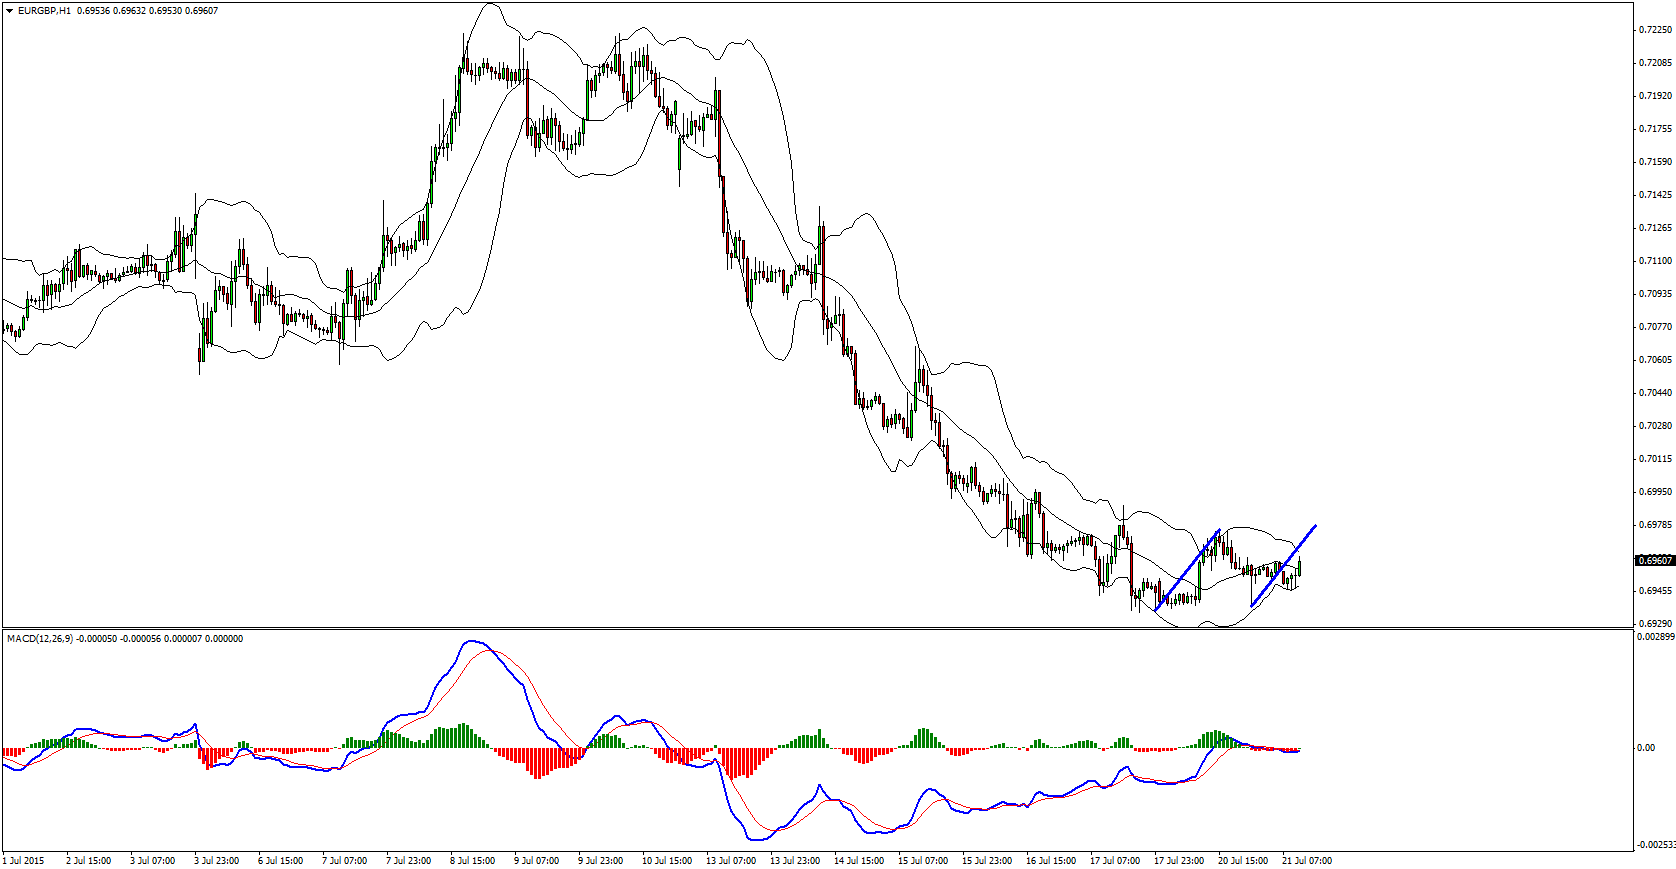
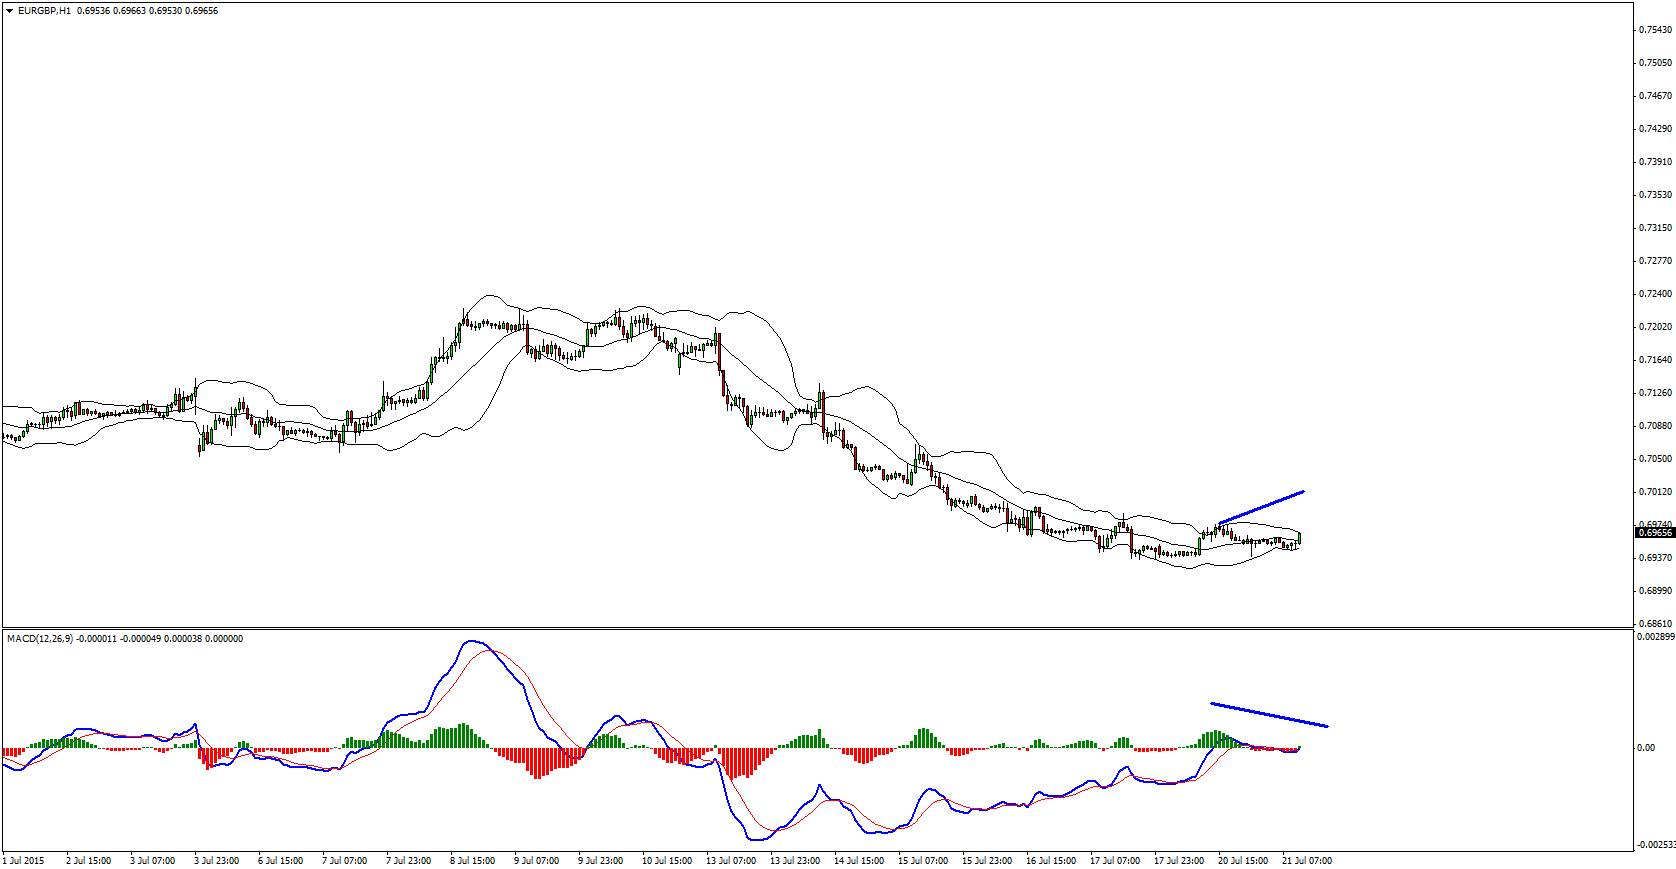
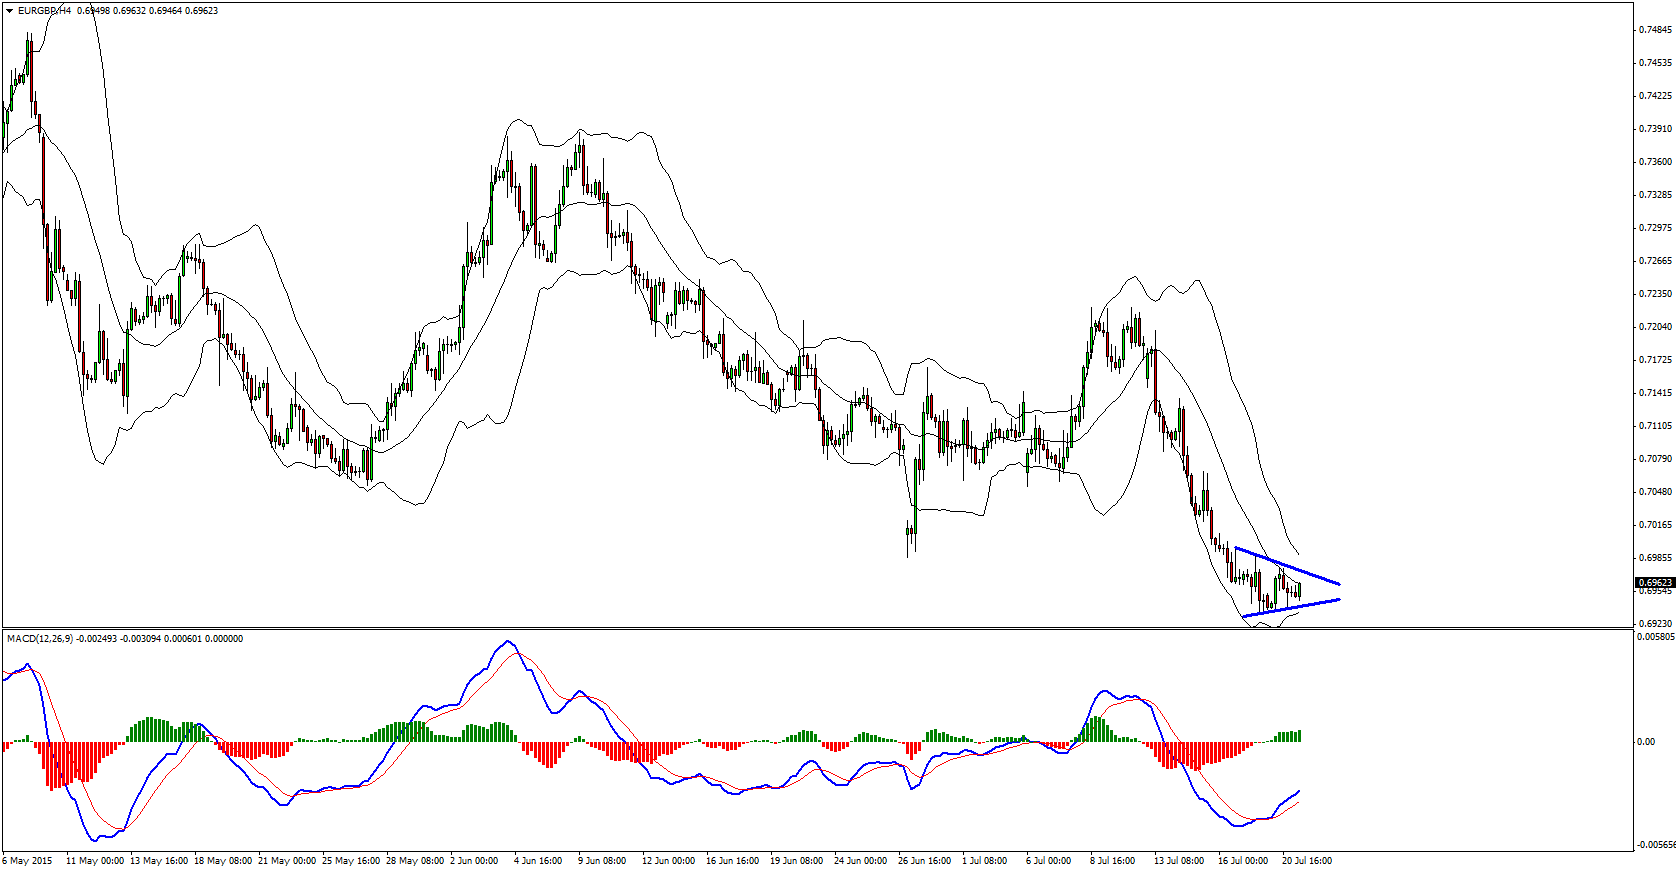
After the strong move down since last week i think the pair should continue lower to around 0.69 zone. This is why I prefer to look for sell opportunities. There are a few ways we can join this potential trade. One way is to wait for double wave correction up on the H1 chart, hidden bearish divergence on the H4 chart confirmed on the H1 chart or simply follow the triangle formation on the H4 chart and once broken go short.
Technical Analysis:
H4 – bearish convergence, triangle, bearish hidden divergence (unconfirmed yet)
H1 – potential double wave cycle up
Entry:
Scenario 1 – H1 chart double wave correction up and look for a short
Scenario 2 – H4 chart hidden divergence is being formed, once confirmed on the H1 chart with regular bearish divergence we can go for a sell
Scenario 3 – H4 breakout of the triangle
Aiming 0.69, cover last high created in the first 2 scenarios, for the third one cover the resistance zone and the lower band of the triangle.
Yours,
Vlad
GDP growth is one of the most important indicators of economic health. But does stronger…
When it comes to fundamental Forex analysis, few institutions matter as much as the Federal…
Interest rates are one of the most important fundamental forces in the Forex market. But…
The latest U.S. employment report has delivered a significant warning for the market. With only…
The Forex market does not always offer clear trading opportunities. Sometimes, price moves sharply in…
Open social media for a few minutes and you can easily find someone talking about…