Hi Traders! Bitcoin forecast follow up and update is here. On November 24th I shared this “Technical Analysis – Bitcoin Short And Mid Term Forecast” post in our blog. In this post, let’s do a recap of this setup and see how it has developed now. If you would like to learn more about the way we trade and the technical analysis we use then check out the Traders Academy Club. Spoiler alert – free memberships are available!
My Idea
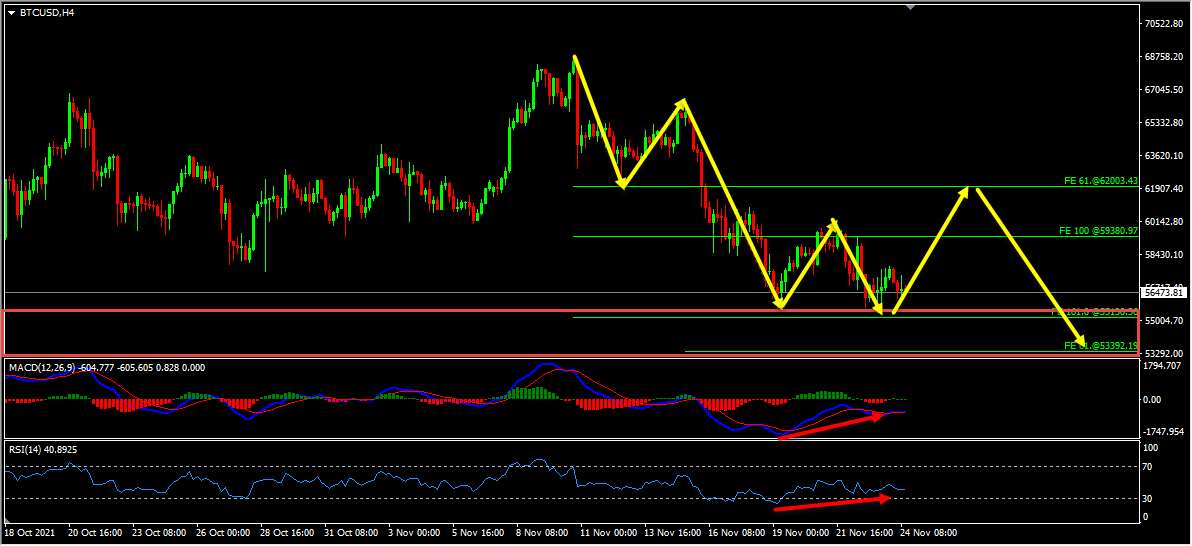
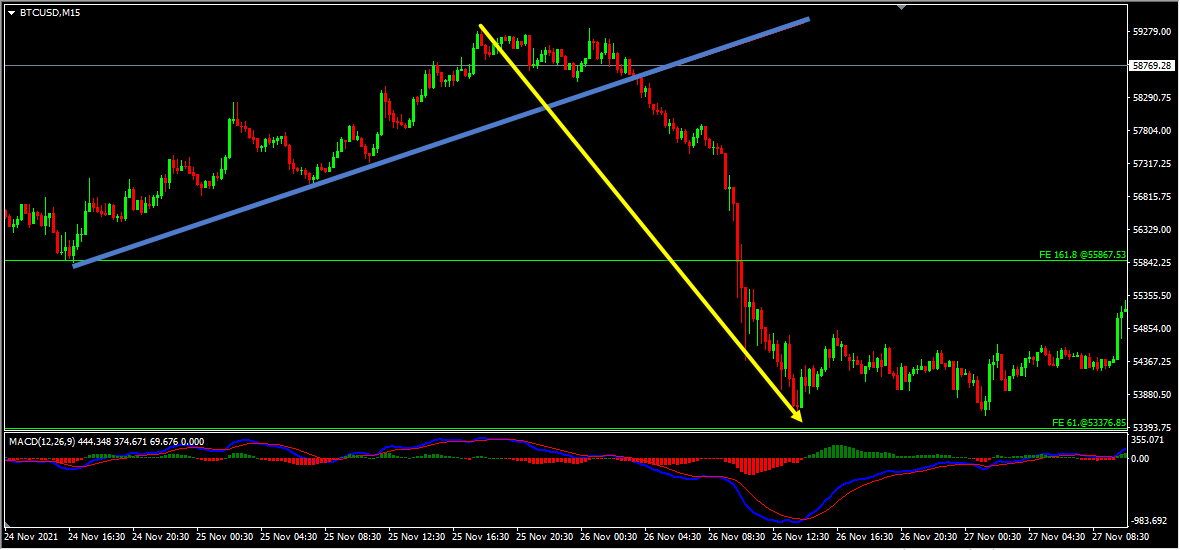
Looking at the H4 chart, we could see that the price which was moving lower has created a bearish trend pattern in the form of three lower highs, lower lows which we may consider as evidence of bearish pressure. Generally, after a bearish trend pattern, we may expect corrections and then further continuation lower. Also, while measuring the first two waves of this bearish trend pattern using the Fibonacci expansion tool we have a key support zone that has formed based on the 161.8%(55138.36) Fibonacci expansion level of the first wave and the 61.8%(53392.19) Fibonacci expansion level of the second wave. Price has currently reached this key support zone and in addition to this, we have a bullish divergence that has formed between the first low that has formed at 55609.76 and the second low that has formed at 55392.00 based on the MACD and RSI indicator which we may consider as evidence of bullish pressure. So based on all this, my short expectation is bullish and my mid term expectation is bearish here.
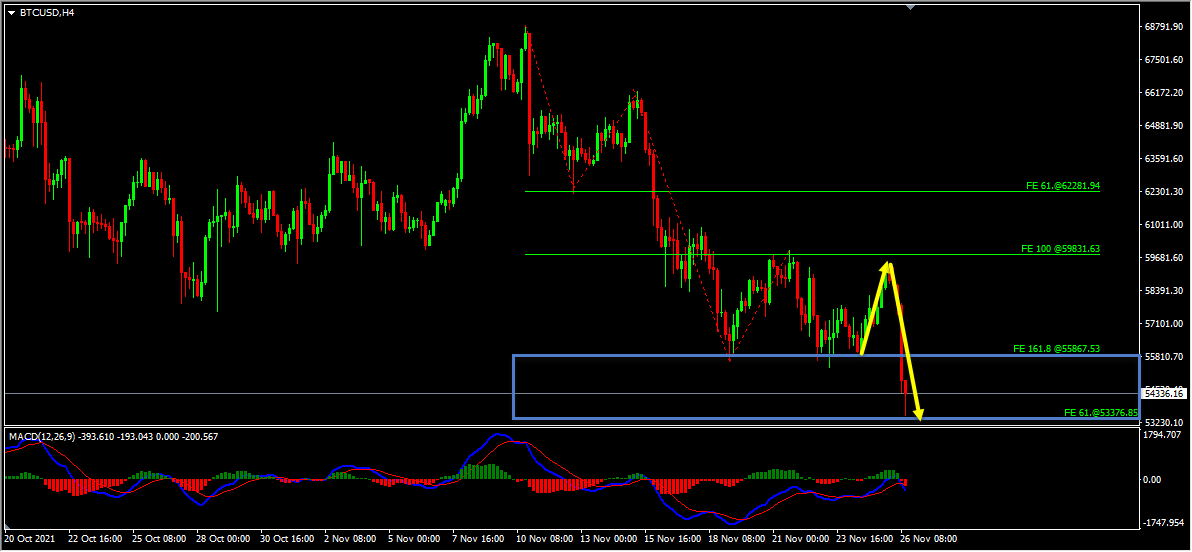
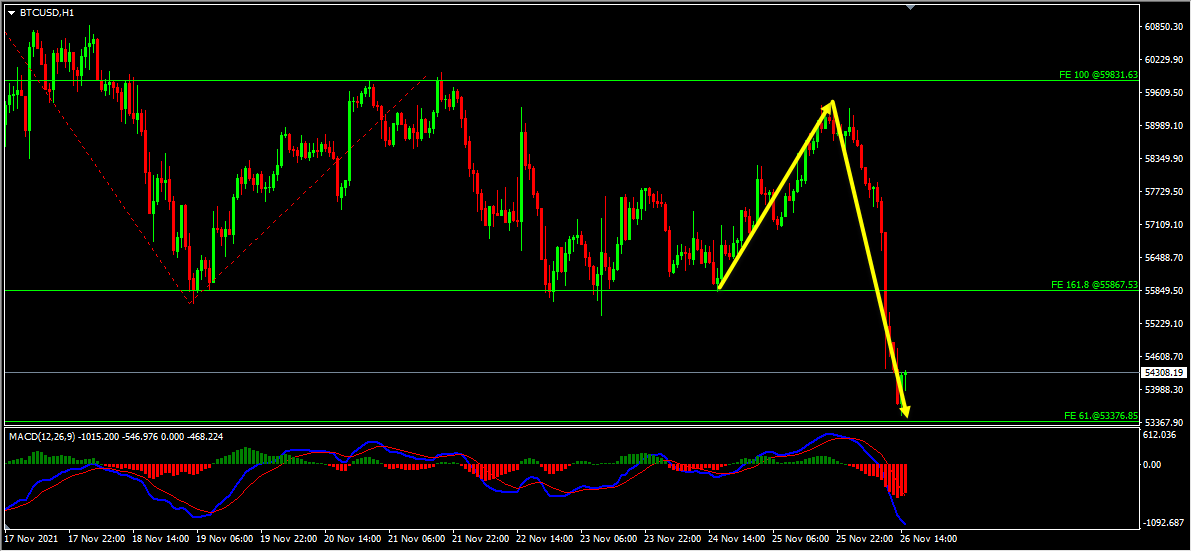
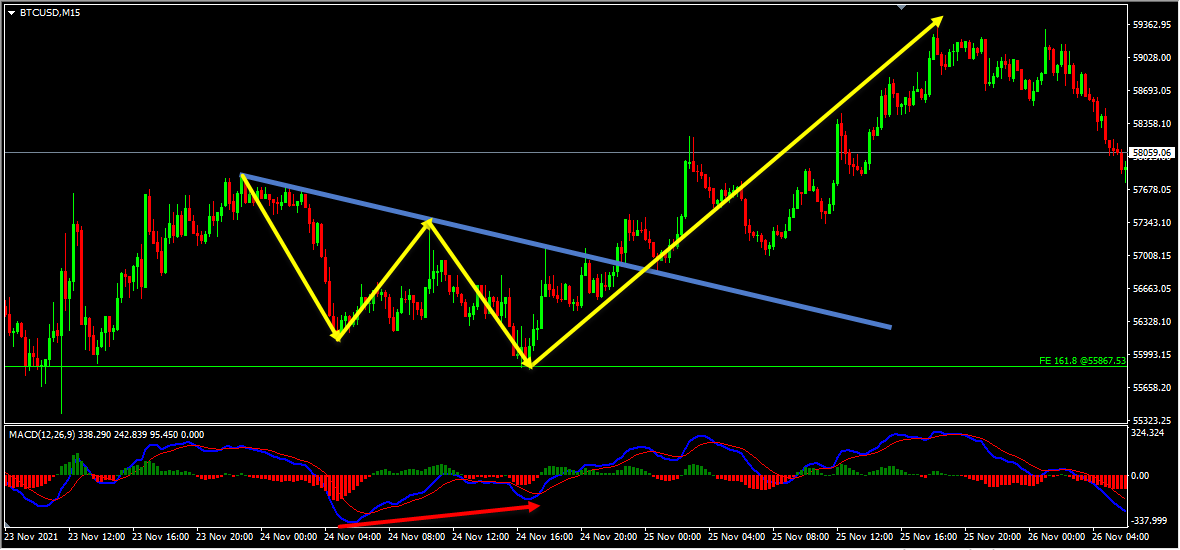
Based on the above-mentioned analysis in Bitcoin my short term view was bullish and my mid term view was bearish. The price action followed my analysis and moved exactly as per the plan here. The short term bullish move happened from the key support zone and then the price moved lower further as I expected it to and delivered a wonderful move to the downside!
(Note: You can learn about a Killer Forex Strategy “Double Trend Line Principle” here)
For similar trade ideas and much more I invite you to
Also, you can get one of our strategies free of charge. You will find all the details here
If you have any further questions, don’t hesitate to drop a comment below!
Happy Trading!
Arvinth Akash
Traders Academy Club Team
Hi Traders! GBPAUD short term forecast and technical analysis is here. We do our analysis…
Hi Traders! USDCHF short term forecast update and follow up is here. On May 20th,…
Hi Traders! CADCHF short term forecast and technical analysis is here. We do our analysis…
The dollar was broadly steady on Monday as cautious investors watched out for signals on…
Hi Traders! Arvinth here from the Home Trader Club team. The weekly summary and, review of July…
European markets edged lower on Thursday following more overnight volatility in Asia’s tech-dominated indexes, while…