Hi Traders! GBPAUD forecast update and follow up is here. On July 2nd I shared this GBPAUD Forecast And Technical Analysis post in my blog. In this post, let’s do a recap of this setup and see how it has developed now. If you would like to learn more about the way we trade and the technical analysis we use then check out the Traders Academy Club. Spoiler alert – free memberships are available!
Missed this trade?
Never miss a trade opportunity again! Join the Traders Academy Club
Now let’s summarize the idea first:
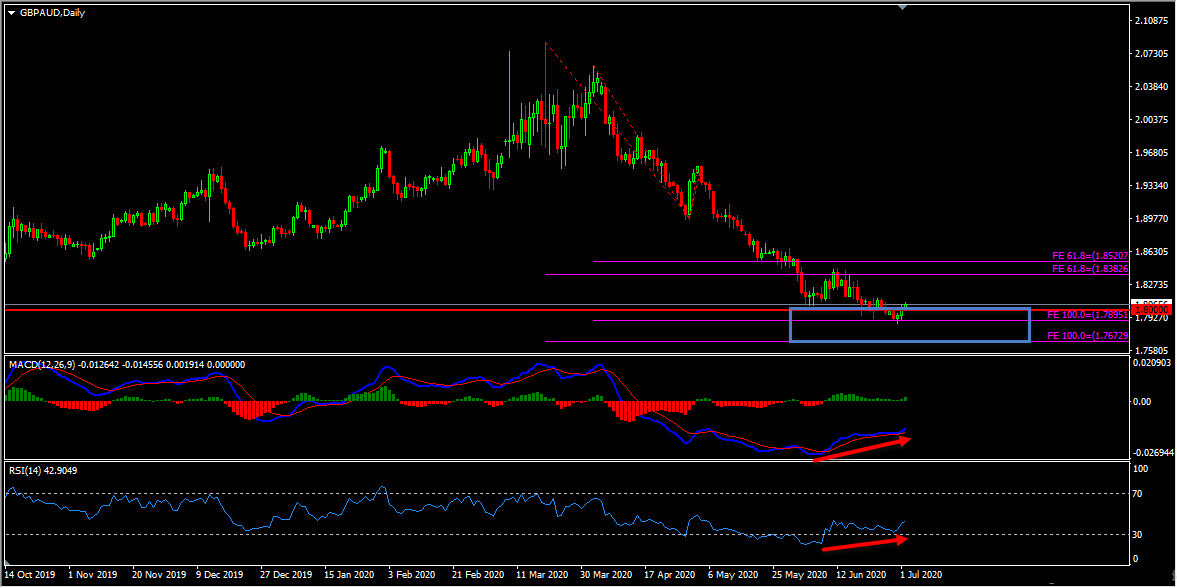
On the daily chart, the price which is moving lower has currently reached a support zone. In addition to this, the 1.80 psychological area coincides with this support zone which makes this area a strong support zone for us. Also, we have a bullish divergence that has formed between the first low that has formed on 4th June 2020 and the second low that has formed on 30th June 2020 based on the moving averages of the MACD indicator and also on the RSI indicator which we may consider as evidence of bullish pressure. We may now move down to lower timeframes and see if we can find evidences supporting this bullish view.
Looking at the H4 chart we could see that we have a bullish divergence that has formed between the first low that has formed on 19th June 2020 and the second low that has formed on 30th June 2020 based on the moving averages of the MACD indicator which we may consider as evidence of bullish pressure. Also the ADX indicator gave a bullish signal at the cross of +DI (green line) versus -DI (red line) and the main signal line (silver line) reads value over 25, we may consider this as another evidence of bullish pressure. In addition to this, the price has also broken above the most recent downtrend line which we may consider as yet another evidence of bullish pressure. So the bottom line here is that the H4 chart has evidences supporting the bullish view.
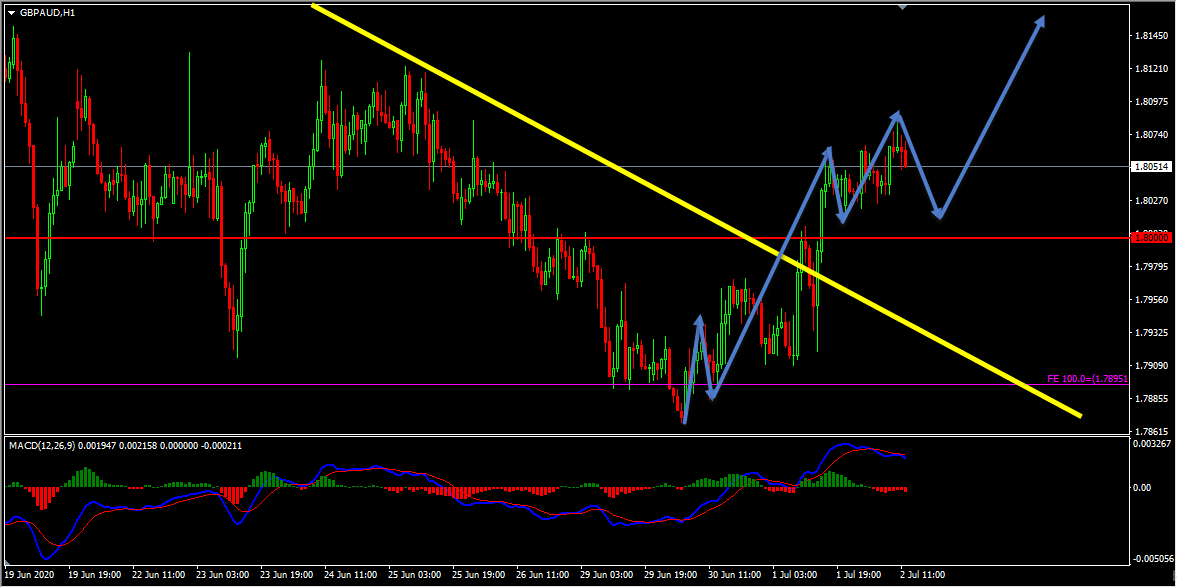
On the H1 chart, the price which is moving higher has created a bullish trend pattern in the form of three higher highs, higher lows which we may consider as evidence of bullish pressure. Currently, it looks like a correction is happening, once this correction completes itself we may then expect further continuation higher.
On last Friday (July 3rd) in my Weekly Trades Summary post I shared an update regarding this idea which is as follows:
Current Scenario – Currently it looks like a deep correction is happening, until the H4 downtrend line breakout holds my view remains bullish here.
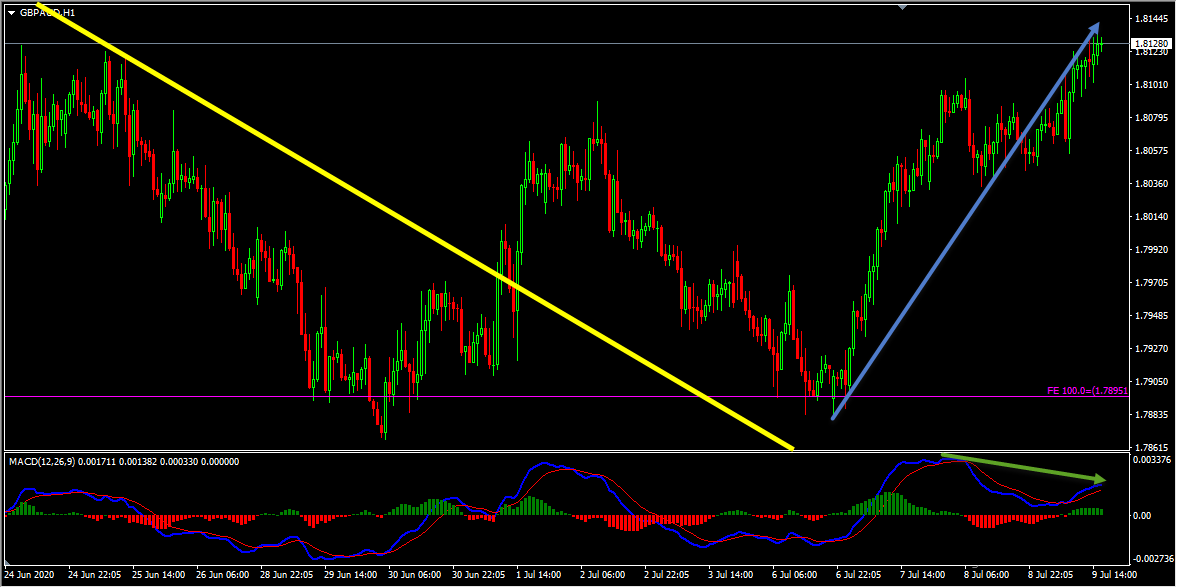
On the H1 chart the price followed my analysis. As I mentioned above until the downtrend line breakout holds my view was bullish here. The price held the downtrend line breakout and also the strong support zone was holding as well. The price then moved higher as I expected it to delivering 250+ pips move so far.
Currently, we have a potential bearish divergence in play on the H1 chart, this is something that we definitely need to pay attention to as it is an opposite evidence. So if you are still involved in the buys then this is a very important place to consider and manage your trade (cash out or partial cash out or trailing protections or partial hedge, etc.. depending on the strategy that you work with). When you find an opposite evidence you should always consider managing your position.
Note: If you want to learn about Money Management you can find it here
So, traders, this is why I wanted to show this example to help you understand how important it is to follow the facts. When the facts do happen as we expected you can see how the price perfectly moved as per the plan. Because these are the kind of hints the market provides us at majority of the times and it’s our obligation as traders to be able to listen to these things that the market tells us and we should try to make the right actions”.
For similar trade ideas and much more join the Traders Academy Club and get access to our complete watch list and trade report.
This is how the report looks like. A table with the hottest market opportunities, screenshot behind every pair and time frame (anything that is in blue inside the table is clickable and leads to a screenshot) + a summary in text format, kind of highlights. And of course, Live Market Analysis every single day.
If you have any further questions, don’t hesitate to drop a comment below!
To your success,
Vladimir Ribakov
Certified Financial Technician
Hi Traders! USDCHF short term forecast update and follow up is here. On May 20th,…
Hi Traders! CADCHF short term forecast and technical analysis is here. We do our analysis…
The dollar was broadly steady on Monday as cautious investors watched out for signals on…
Hi Traders! Arvinth here from the Home Trader Club team. The weekly summary and, review of July…
European markets edged lower on Thursday following more overnight volatility in Asia’s tech-dominated indexes, while…
Hi Traders! EURGBP short term forecast and technical analysis is here. We do our analysis…