Hi Traders! Gold and GBPJPY forecast and technical analysis is here. As we do in every technical post we are going to perform the multi-time frame analysis on Gold and GBPJPY. We do our analysis on the MetaTrader4 platform (MT4). Some very interesting and useful tips and hacks about the MT4 platform could be found here. Both Gold and GBPJPY definitely looks interesting at the moment so as usual we will start our analysis from the highest timeframe. The technical analysis is as follows:
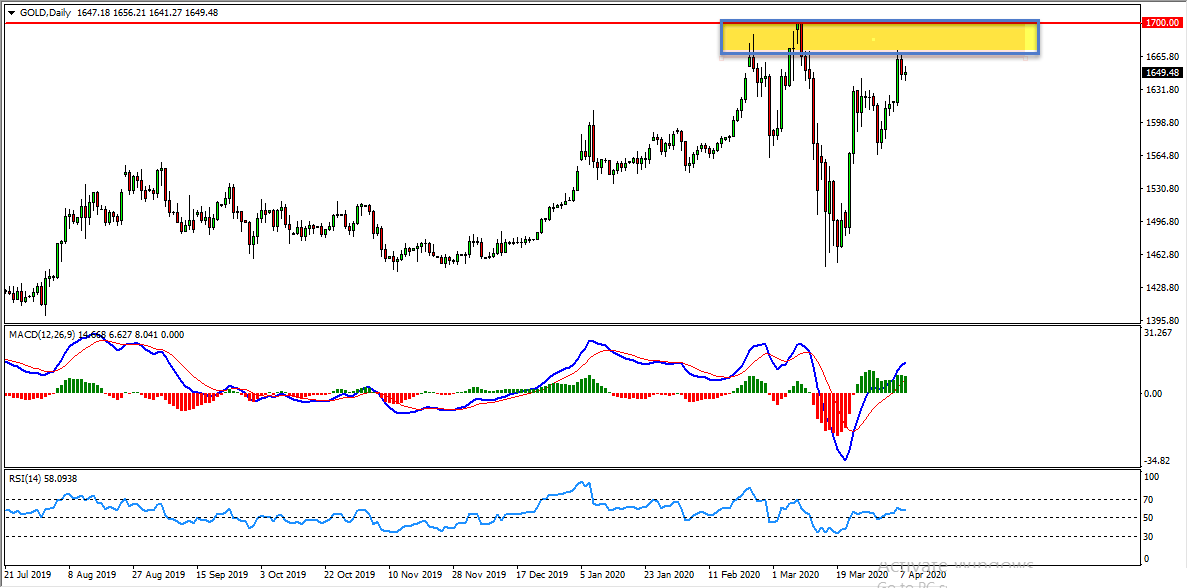
On the daily chart we have a resistance zone that has formed based on the previous highs and the price is respecting it so far. In addition to this we also have the psychological level 1700 coinciding in the same area which makes this area an important resistance zone for us.
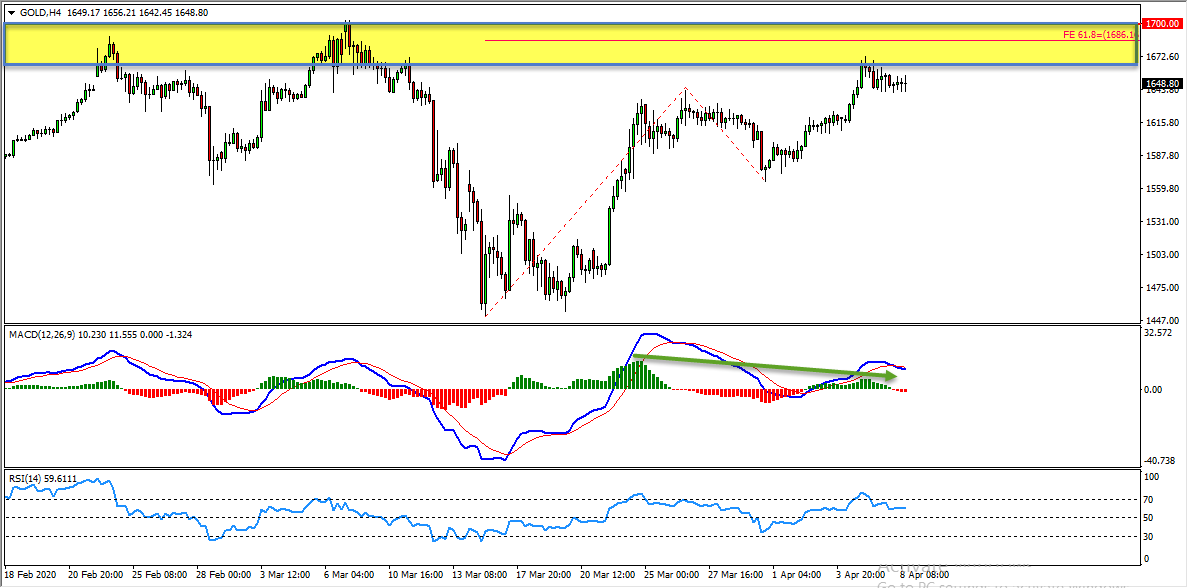
On the H4 chart while measuring the first wave we have using the fibonacci expansion tool we could see that the 61.8% fibonacci expansion level at 1686.16 coincides with the daily resistance zone which makes this area a very important resistance zone. Also in addition to this we have a bearish divergence that has formed on 24th March 2020 and the second high that has formed on 6th April 2020 based on the moving averages and the histogram of the MACD indicator which we may consider as an evidence of bearish pressure. So until this important resistance zone holds my view remains bearish here.
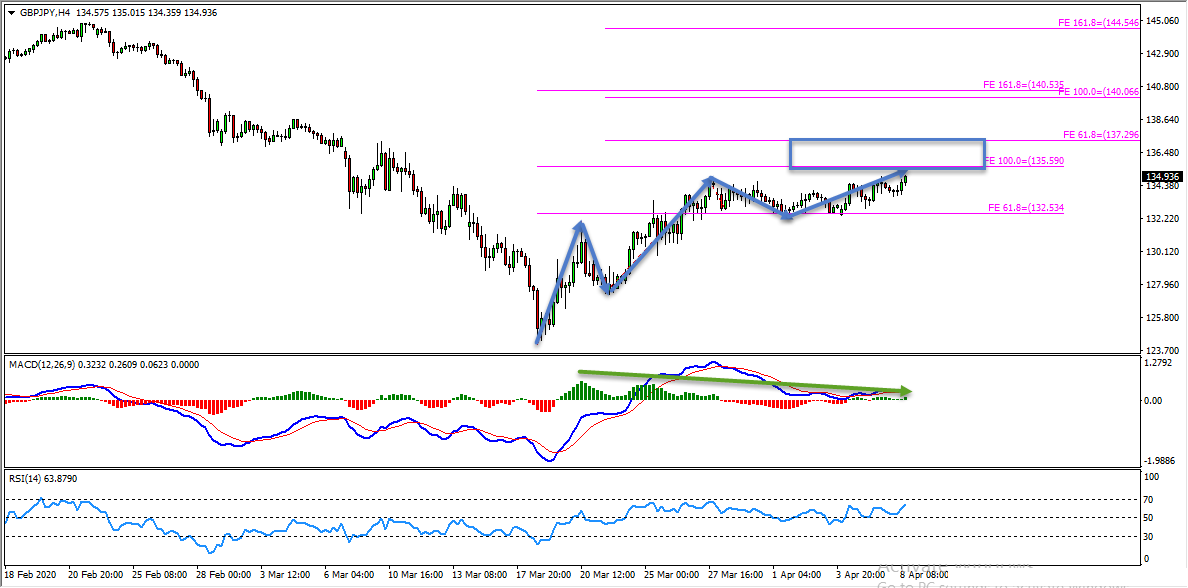
On the H4 chart the price which is moving higher has created a bullish trend pattern. Currently the price has reached an important resistance zone formed by the 100% fibonacci expansion level of the first wave we have at 135.590 and the 61.8% fibonacci expansion level of the second wave we have at 137.296. In addition to this we also have a bearish divergence that has formed between the first high that has formed on 20th March 2020 and the second high that has formed on 8th April 2020 which we may consider as an evidence of bearish pressure.
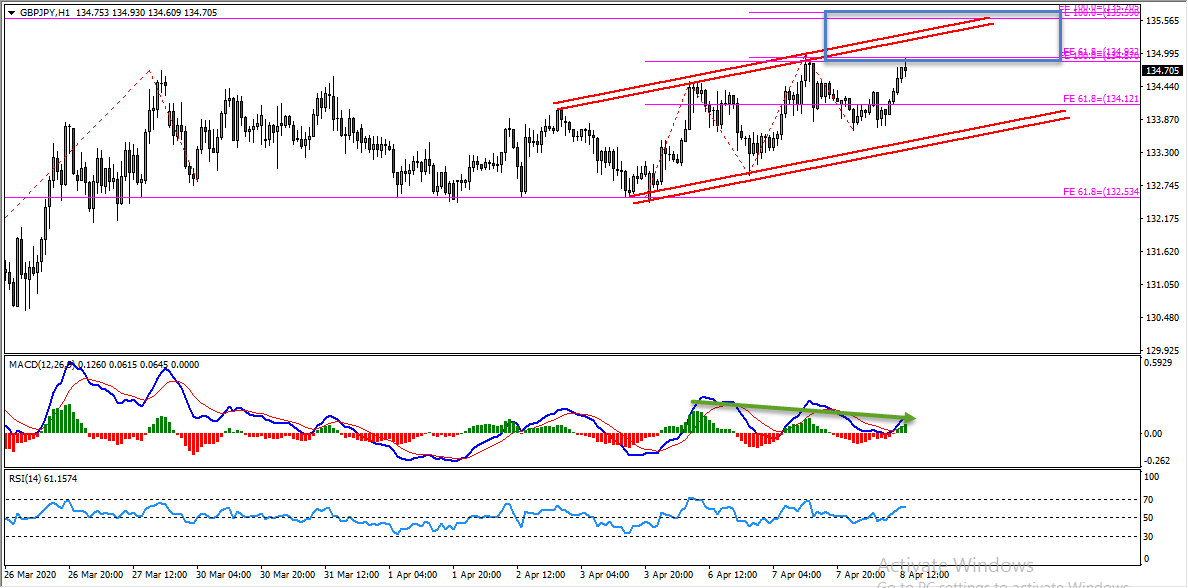
On the H1 chart the price is currently moving inside a bullish channel. This channel is formed by the price reaching parallel support and resistance zones. The price which is respecting these two zones so far is currently nearing the top of this channel. While measuring the fibonacci expansion levels of the two waves that we have inside this channel we could see that the 100% and the 161.8% of these two waves coincides with the H4 resistance zone and also with the top of the bullish channel. Also in addition to this we have a potential bearish divergence that is forming at the moment. Until this important resistance zone shown in the screenshot below holds my short term view remains bearish here.
It is always recommended to look for confirmations before you jump into any trade. If you are not sure about how to trade this sell setup then you can use any setup and strategy that you have in your arsenal to look for bearish moves and join this sell trade.
Also don’t forget to protect your sell trade using a stop loss and make sure to set a target and keep a proper risk reward ratio.
You will also find a pretty extensive database of educational materials here in the blog – just use the search or check out the Forex Education section above.
Not sure how to enter a trade? Spot reversals (bounces)? Not sure how to spot breakouts?
I invite you to join me in my live trading rooms, on daily basis, and improve your trading with us.
Also you can get one of my strategies free of charge. You will find all the details here
If you have any further questions, don’t hesitate to drop a comment below!
Yours to your success
Vladimir Ribakov
Certified Financial Technician
The new trading week presents several high-probability opportunities across the forex and commodities markets. After…
Hi Traders! Arvinth here from the Home Trader Club team. The weekly summary and, review of July…
Hi Traders! UK100 short term forecast and technical analysis is here. We do our analysis…
Hi Traders! CADCHF short term forecast follow-up and update is here. On May 14th 2026…
Hi Traders! EURNZD short term forecast and technical analysis is here. We do our analysis…
Hi Traders! AUDCAD short term forecast update and follow up is here. On May 12st…
View Comments
These kind of trade set up/forecast post really helps for the betterment of my trading
Thank you Vlad, will follow these for sure.