Hi Traders! Arvinth here from the Home Trader Club team. The weekly summary and, review of September 1st 2023 is here. It is now time to recap and summarize the trade setups that we had during this week. Below you will find a short explanation of all the trade setups we had this week and how it has currently developed now.
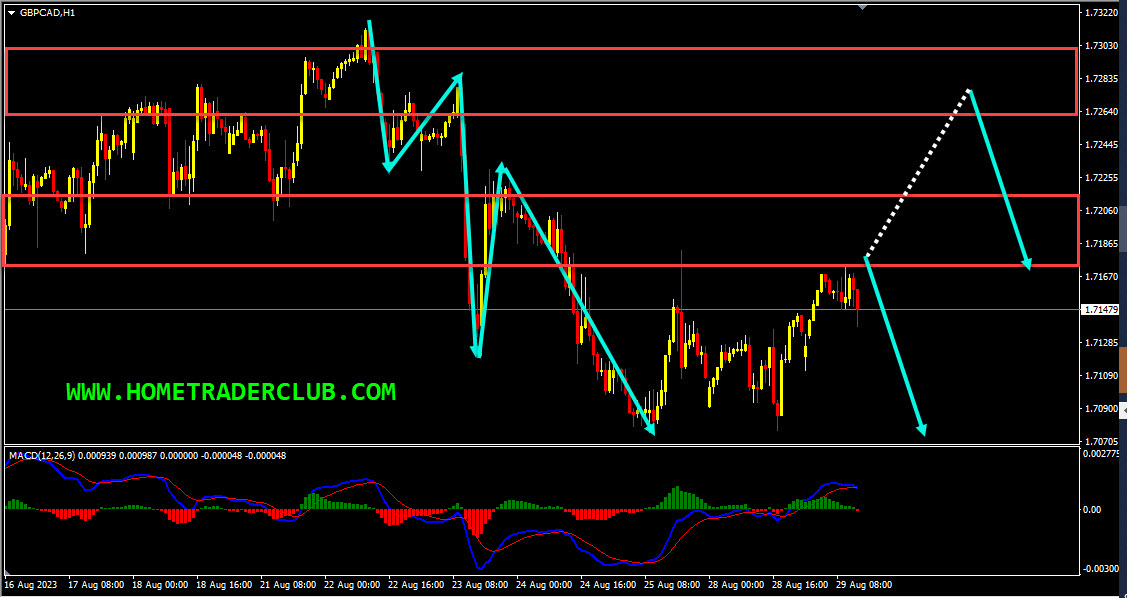
GBPCAD – My idea here was “On the H1 chart, we could see that the price which is moving lower has created a bearish trend pattern in the form of three lower highs, and lower lows which we may consider as evidence of bearish pressure. Generally, after a bearish trend pattern, we may expect corrections and then a further continuation lower. Currently, it looks like a correction is happening. Also, we had two strong support zones that have formed, the price moved lower broke below these zones and is holding below them, we may consider this as yet another evidence of bearish pressure. Currently, these strong support zones are acting as strong resistance zones for us. Also, currently there are no signs opposing this short term bearish view. So based on all this, until these two strong resistance zones (marked in red) shown in the image below hold my short-term view remains bearish here and I expect the price to move lower further after pullbacks”.
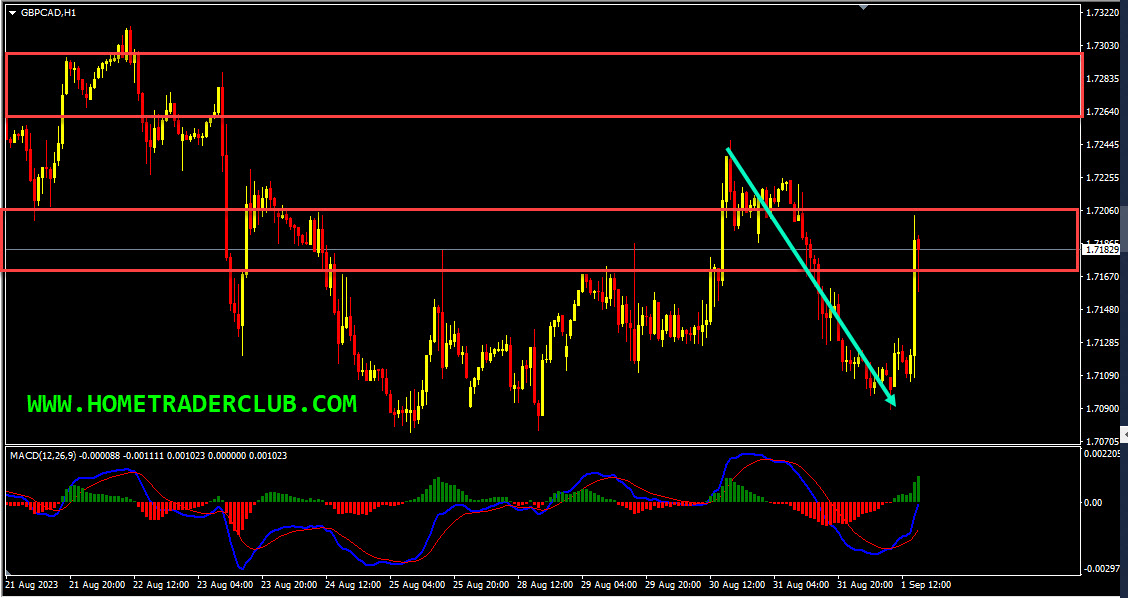
Current Scenario – In this pair, based on the above-mentioned analysis, I was expecting short term bearish moves to happen until the two strong resistance zones hold. The price action followed my analysis, exactly as I expected it to here. The price which was moving higher reached the first strong resistance zone, respected it and bounced lower from this zone, and delivered around 150+ pips move so far!
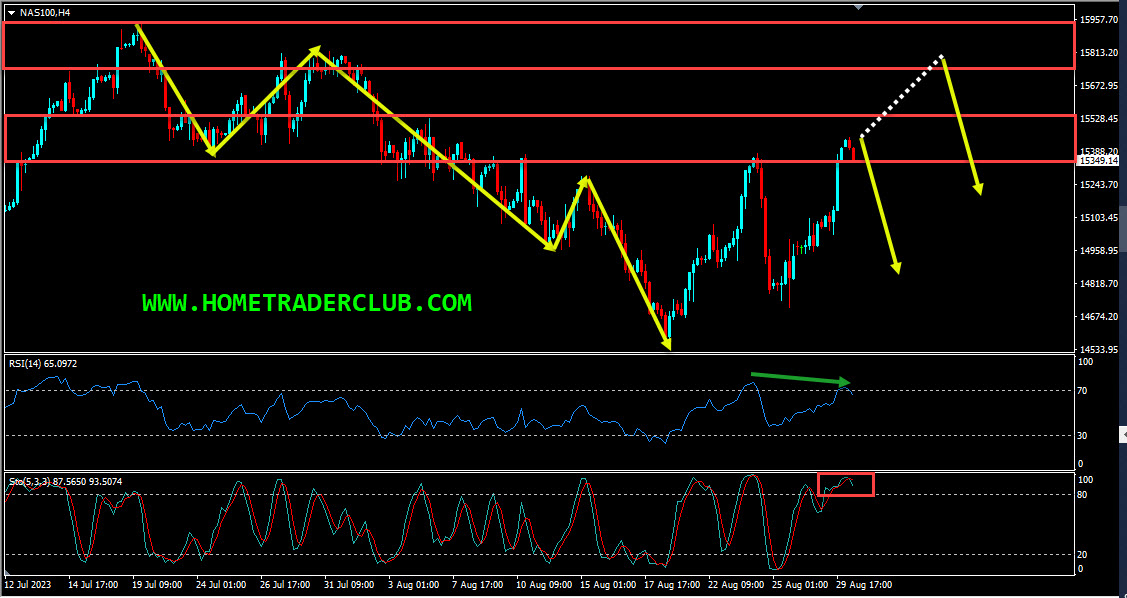
NASDAQ – My idea here was “On the H4 chart, we could see that the price which is moving lower has created a bearish trend pattern in the form of three lower highs and, lower lows we may consider this as evidence of bearish pressure. Generally, after a bearish trend pattern, we may expect corrections and then further continuation lower. Currently, it looks like the correction is happening in the form of potential double wave to the upside. Also, we could see the price has created a bearish divergence between the first high that has formed on 24th August 2023 and the second high that has formed on 30th August 2023 based on the RSI indicator. We may consider these as signs indicated by the market that the buyers are losing control and the sellers are currently having the upper hand. In addition to this, based on the Stochastic Oscillator we could see that the price has reached its extreme (80 level) which we may consider as another sign favouring the sellers. In addition to this, currently there are no signs opposing this short term bearish view. So based on all this, until the two strong resistance zones (marked in red) shown in the image below hold my short term view remains bearish here and I expect the price to move lower further after pullbacks”.
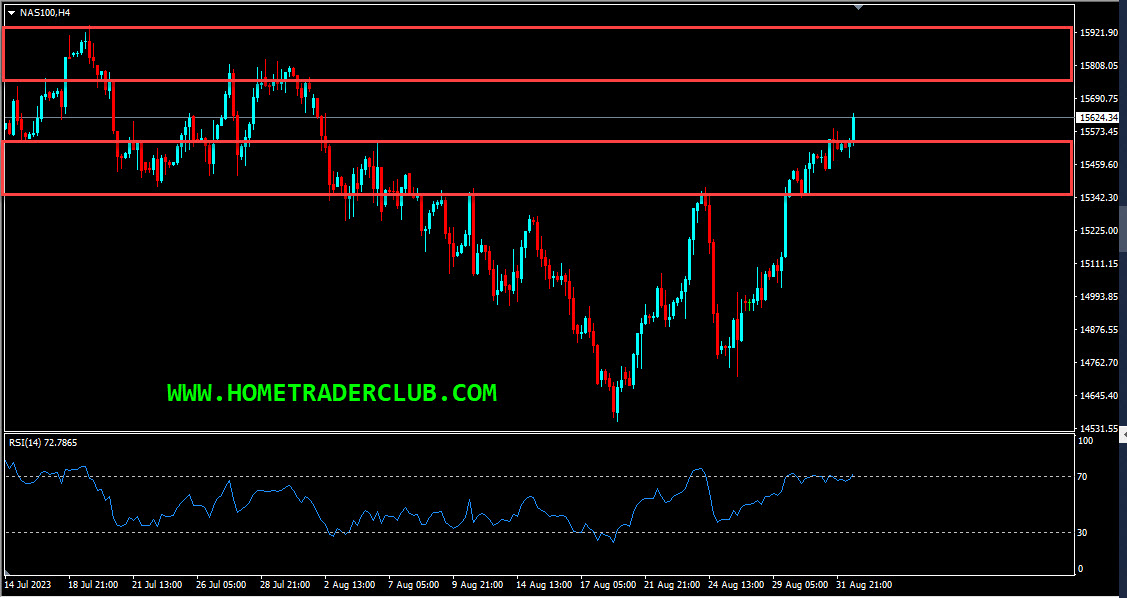
Current Scenario – In NASDAQ, the price has currently broken above the first strong resistance zone and is holding above it. Until the second strong resistance zone holds my short term view still remains bearish here and I expect the price to move lower further.
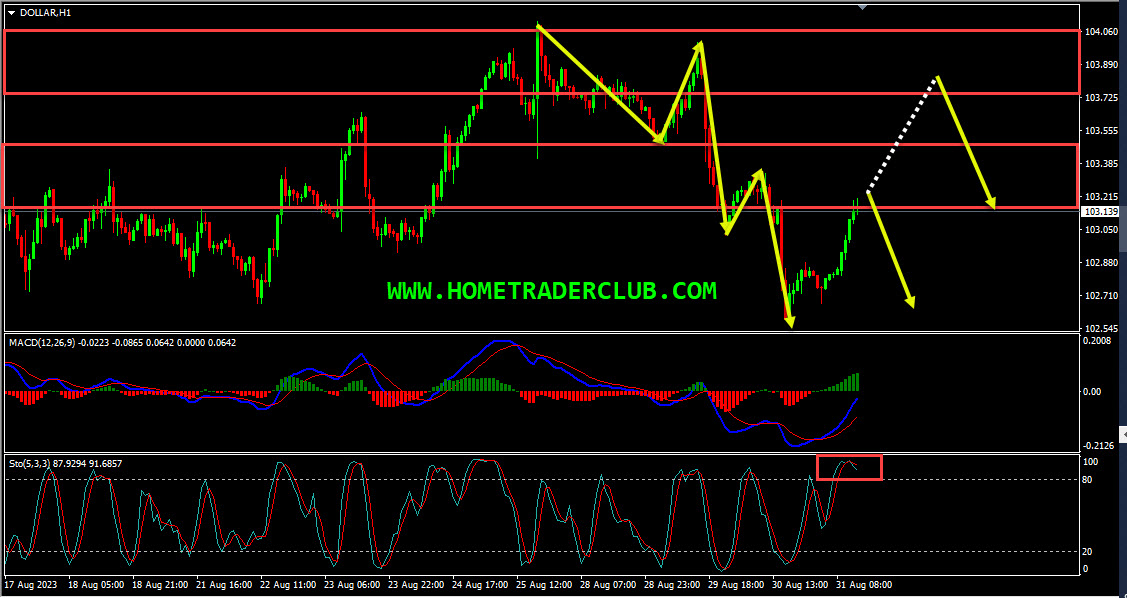
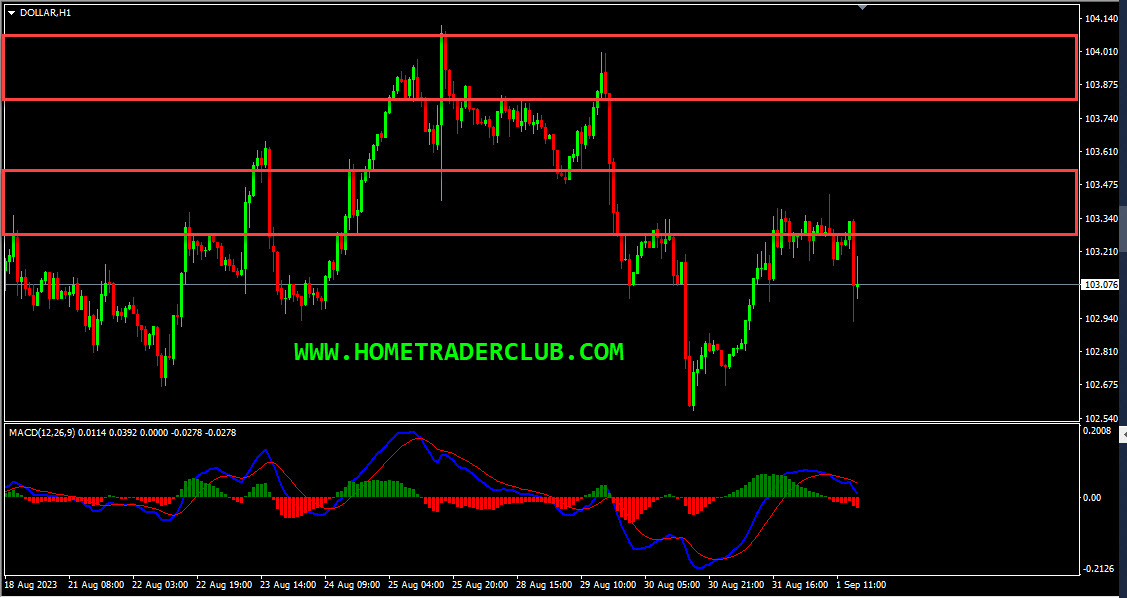
US Dollar Index – My idea here was “On the H1 chart, the price which is moving lower has created a bearish trend pattern in the form of three lower highs, lower lows which we may consider as evidence of bearish pressure. Generally, after a bearish trend pattern, we may expect corrections and then further continuation lower. Currently it looks like a correction is happening and also based on the Stochastic Oscillator we could see that the price has reached it’s extreme which we may consider as another evidence of bearish pressure. In addition to this, currently there are no signs opposing this short term bearish view here as well. Also, we had two strong support zones that has formed and the price which is moving lower has broken below these zones and is holding below them, we may consider this as yet another evidence of bearish pressure. Currently, these strong support zones are acting as strong resistance zones for us. Until these two strong resistance zones (marked in red) shown in the image below hold my short term view remains bearish here and I expect the price to move lower further”.
Note: You can follow us here on Trading View and also on our blog to get similar ideas on daily basis)
For similar trade ideas and much more I invite you to join the Home Trader Club and improve your trading with us.
You will also find a pretty extensive database of educational materials here in the blog – just use the search or check out the Forex Education section above.
If you have any further questions, don’t hesitate to drop a comment below!
Happy Trading!
Arvinth Akash
Home Trader Club Team.
GDP growth is one of the most important indicators of economic health. But does stronger…
When it comes to fundamental Forex analysis, few institutions matter as much as the Federal…
Interest rates are one of the most important fundamental forces in the Forex market. But…
The latest U.S. employment report has delivered a significant warning for the market. With only…
The Forex market does not always offer clear trading opportunities. Sometimes, price moves sharply in…
Open social media for a few minutes and you can easily find someone talking about…