Hi Traders! GBPNZD short term forecast follow up and update is here. On March 30th I shared this “GBPNZD Short Term Forecast And Technical Analysis” post in our blog. In this post, let’s do a recap of this setup and see how it has developed now. If you would like to learn more about the way we trade and the technical analysis we use then check out the Home Trader Club. Spoiler alert – free memberships are available!
My Idea
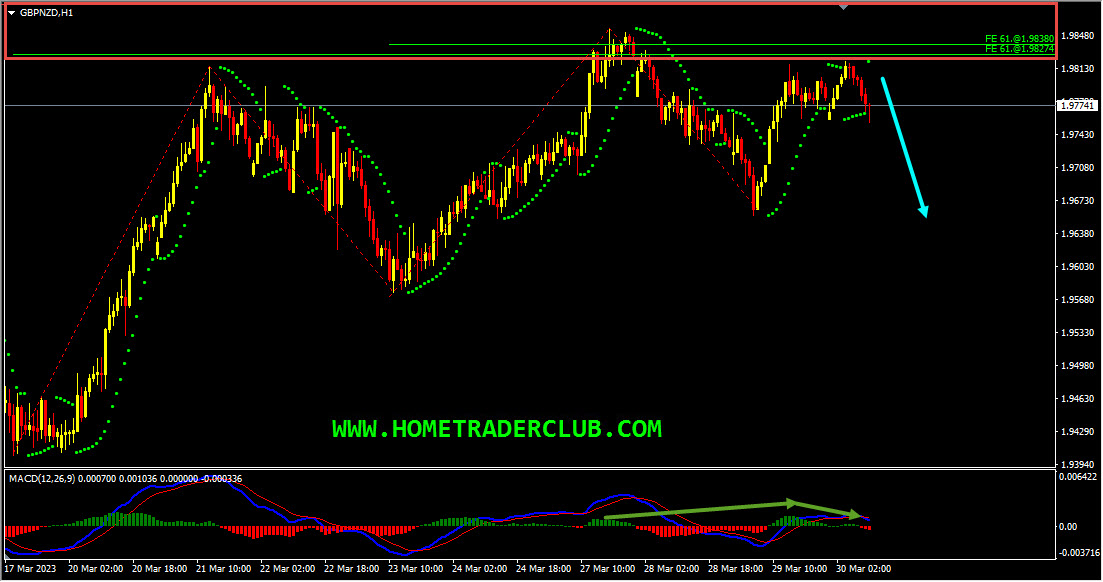
On the H1 chart, the price which is moving higher has currently reached a key resistance zone, respected it and is bouncing lower from this zone. This key resistance zone is formed by the 61.8%(1.98274) Fibonacci expansion level of the big wave and the 61.8%(1.98380) Fibonacci expansion level of the small wave. In addition to this, we could see that the price has created a bearish hidden divergence between the first high formed at 1.98554 and the second high formed at 1.98170, followed by a continuing bearish divergence between the first high that has formed at 1.98170 and the second high that has formed at 1.98198 based on the MACD indicator, which we may consider as evidence of bearish pressure. Also, currently, there are no signs opposing this short-term bearish view. So everything looks good here for the bears and until the key resistance zone (marked in red) shown in the image below holds my short-term view remains bearish here.
In this pair on the H1 chart, based on my technical analysis, I mentioned that “until the key resistance zone holds, my short-term view remains bearish here, and I expect the price to move lower further.” The price action followed my analysis exactly as I expected it to here. The price provided a first move to the downside and delivered 160+ pips move, we then had a pullback, but most importantly the price was holding below the key resistance zone. The price then provided a second move to the downside and delivered 300+ pips move!
On the M15 chart, the market provided us with various facts supporting the bearish view. The price, which was moving higher on the M15 chart, created a bearish divergence between the first high, formed at 1.98170 and the second high, formed at 1.98364 based on the MACD indicator. The price then moved lower and broke below the most recent uptrend line. We may consider these as facts provided by the market supporting the bearish view, and there were no signs opposing this bearish view. Then as you can see in the image below, the price moved lower further after that and provided an amazing move to the downside!
So, traders, this is why I wanted to show this example to help you understand how important it is to follow the facts. The facts were supporting the bearish view here, and there were no signs against it. When the facts do happen as we expected, you can see how the price perfectly moved as per the plan. Because these are the kind of hints the market provides us with the majority of the time, it’s our obligation as traders to be able to listen to these things that the market tells us, and we should try to make the right actions accordingly.
For similar trade ideas and much more I invite you to
Also, you can get one of our strategies free of charge. You will find all the details here
Download our best forex indicators here
If you have any further questions, don’t hesitate to drop a comment below!
Happy Trading!
Arvinth Akash
Home Trader Club Team.
When it comes to fundamental Forex analysis, few institutions matter as much as the Federal…
Interest rates are one of the most important fundamental forces in the Forex market. But…
The latest U.S. employment report has delivered a significant warning for the market. With only…
The Forex market does not always offer clear trading opportunities. Sometimes, price moves sharply in…
Open social media for a few minutes and you can easily find someone talking about…
EURUSD, GBPUSD, USDJPY, Gold and Bitcoin remain at important technical levels as volatility and geopolitical…