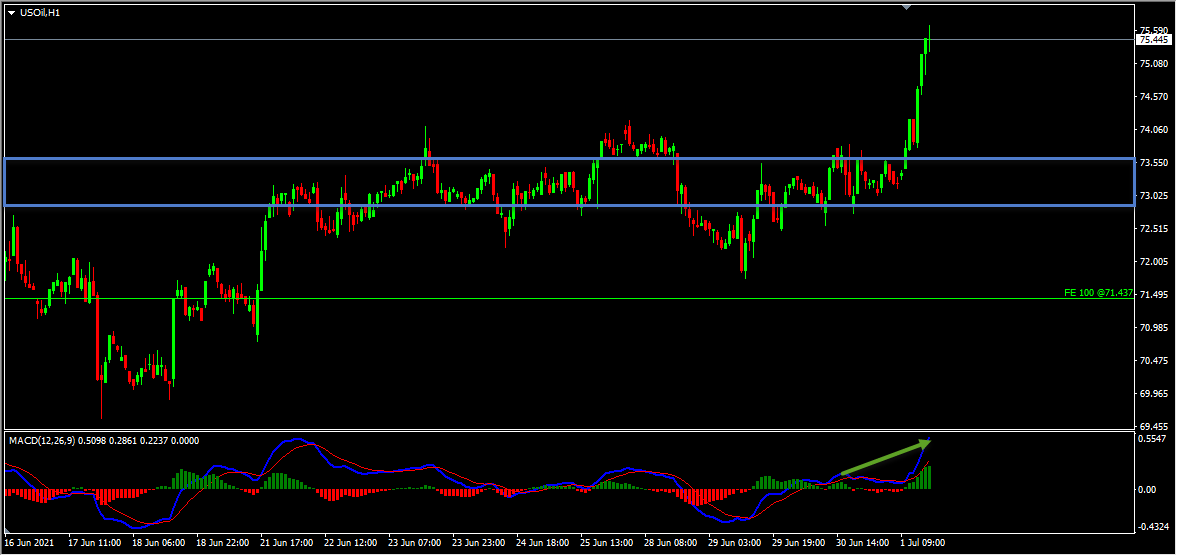
Hi Traders! Oil forecast update and follow up is here. On June 29th I shared this “Oil Forecast And Technical Analysis” post in my blog. In this post, let’s do a recap of this setup and see how it has developed now. If you would like to learn more about the way we trade and the technical analysis we use then check out the Traders Academy Club. Spoiler alert – free memberships are available!
My Idea
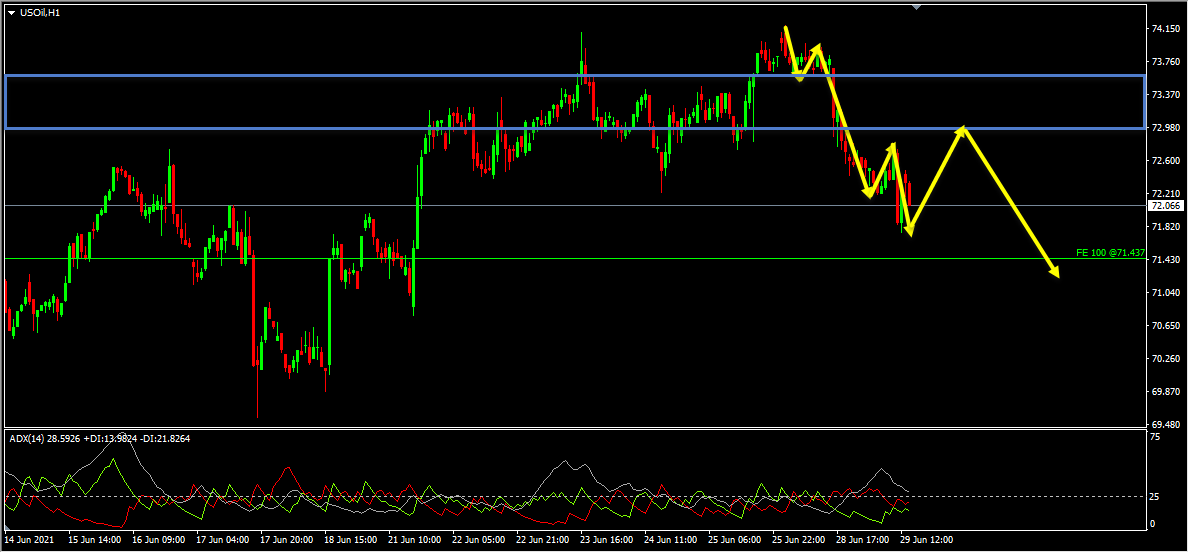
On the H1 chart, the price which is moving lower has created a bearish trend pattern in the form of three lower highs, lower lows which we may consider as evidence of bearish pressure. Generally, after a bearish trend pattern, we may expect corrections and then further continuation lower. Also, the ADX indicator gave a bearish signal here as well at the cross of -DI (red line) versus +DI (green line), and the main signal line (silver line) reads value over 25, we may consider this as yet another evidence of bearish pressure. Until the strong resistance zone (marked in blue) shown in the image below holds my view remains bearish here and I expect the price to move lower further.
Note: You can watch my webinar on how to cut losses early here
In order to learn about this and much more, I invite you to join the
Also, you can get one of our strategies free of charge. You will find all the details here
If you have any further questions, don’t hesitate to drop a comment below!
To your success,
Vladimir Ribakov
Certified Financial Technician
When it comes to fundamental Forex analysis, few institutions matter as much as the Federal…
Interest rates are one of the most important fundamental forces in the Forex market. But…
The latest U.S. employment report has delivered a significant warning for the market. With only…
The Forex market does not always offer clear trading opportunities. Sometimes, price moves sharply in…
Open social media for a few minutes and you can easily find someone talking about…
EURUSD, GBPUSD, USDJPY, Gold and Bitcoin remain at important technical levels as volatility and geopolitical…