Hi Traders! GBPCHF short term forecast and technical analysis is here. The way I would like to analyze the chart for setups is based on multi-timeframe confirmations because in my POV if we get more evidences on different timeframes for the same direction then it makes the setup much more reliable. If you would like to learn more about the way we trade and the technical analysis we use then check out the Traders Academy Club Spoiler alert – free memberships are available! Let’s start our analysis from the highest timeframe which will be the daily chart here.
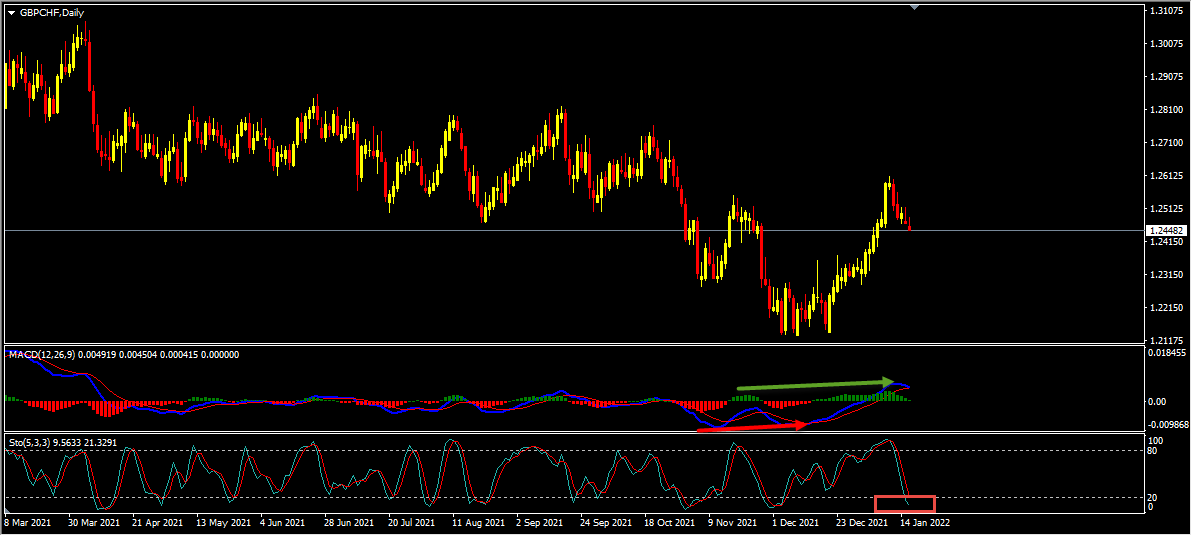
On the daily chart, the price which was moving lower created a bullish divergence that has formed between the first low that has formed at 1.22780 and the second low that has formed at 1.21360 based on the MACD indicator. The price then moved higher and broke above the last high at 1.25519 creating higher highs, thus forming a classical setup of bullish divergence followed by bullish convergence. Hence as per the book scenario, after a bullish convergence, we may look for corrections to happen and then further continuation to the upside. Currently it looks like a correction is happening. In addition to this, based on the Stochastic Oscillator, we could see that the price has reached its extreme which we may consider as evidence of bullish pressure. Also, currently there are no signs opposing this short term bullish view. We may now move down to lower timeframe and see if we can find evidences supporting this bullish view.
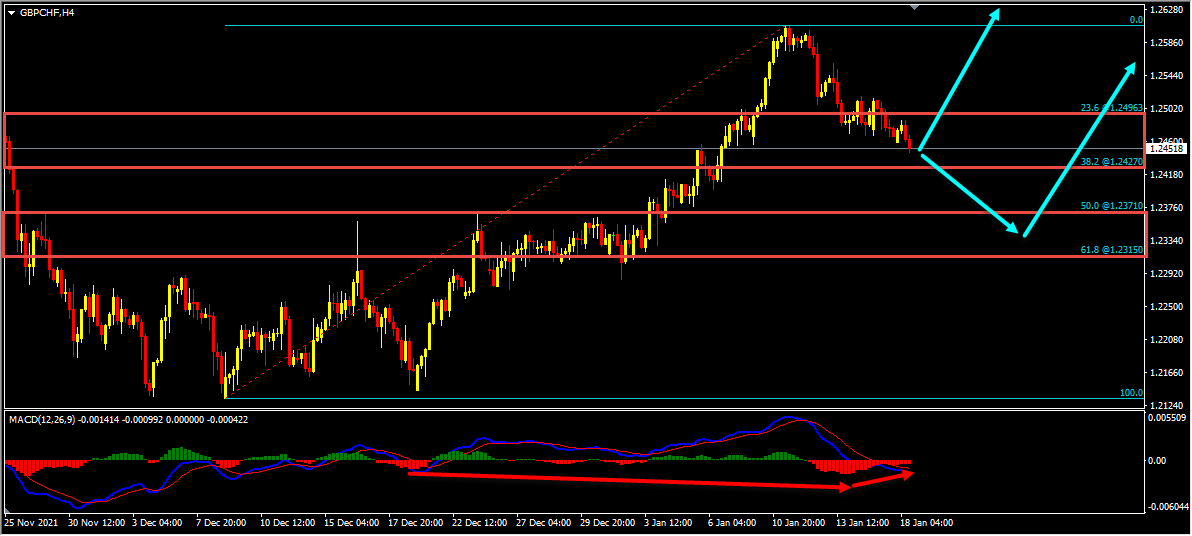
Looking at the H4 chart we could see that the price has created a bullish hidden divergence between the first low that has formed at 1.21428 and the second low that has formed at 1.24712 based on the MACD indicator which we may consider as evidence of bullish pressure. So the bottom line here is that the H4 chart has evidence supporting the bulls. Also, we have two key support zones that has formed, the first key support zone is formed by the 23.6%(1.24963) – 38.2%(1.24770) Fibonacci retracement levels of the big bullish move. The second key support zone is formed by the 50%(1.23710) – 61.8%(1.23150) Fibonacci retracement levels of the big bullish move. Until both these key support zones hold my short term view remains bullish here.
GBPCHF D1(Daily) Chart Analysis
GBPCHF H4(4 Hours) Chart Analysis
It is always recommended to look for confirmations before you jump into any trade. If you are not sure about how to trade this short term buy setup then you can use any setup and strategy that you have in your arsenal to look for bullish moves and join this buy trade.
Also, don’t forget to protect your buy trade using a stop loss and make sure to set a target and keep a proper risk/reward ratio.
You will also find a pretty extensive database of educational materials here in the blog – just use the search or check out the Forex Education section above.
Not sure how to enter a trade? Spot reversals (bounces)? Not sure how to spot breakouts?
I invite you to
And improve your trading with us.
Also, you can get one of our strategies free of charge. You will find all the details here
If you have any further questions, don’t hesitate to drop a comment below!
Happy Trading!
Arvinth Akash
Traders Academy Club Team
Hi Traders! USDCHF short term forecast update and follow up is here. On May 20th,…
Hi Traders! CADCHF short term forecast and technical analysis is here. We do our analysis…
The dollar was broadly steady on Monday as cautious investors watched out for signals on…
Hi Traders! Arvinth here from the Home Trader Club team. The weekly summary and, review of July…
European markets edged lower on Thursday following more overnight volatility in Asia’s tech-dominated indexes, while…
Hi Traders! EURGBP short term forecast and technical analysis is here. We do our analysis…