Hi Traders! USDCHF short term forecast and technical analysis is here. We do our analysis on the MetaTrader4 platform (MT4). Some very interesting and useful tips and hacks about the MT4 platform could be found here. If you would like to learn more about the way we trade and the technical analysis we use then check out the Traders Academy Club Spoiler alert – free memberships are available!
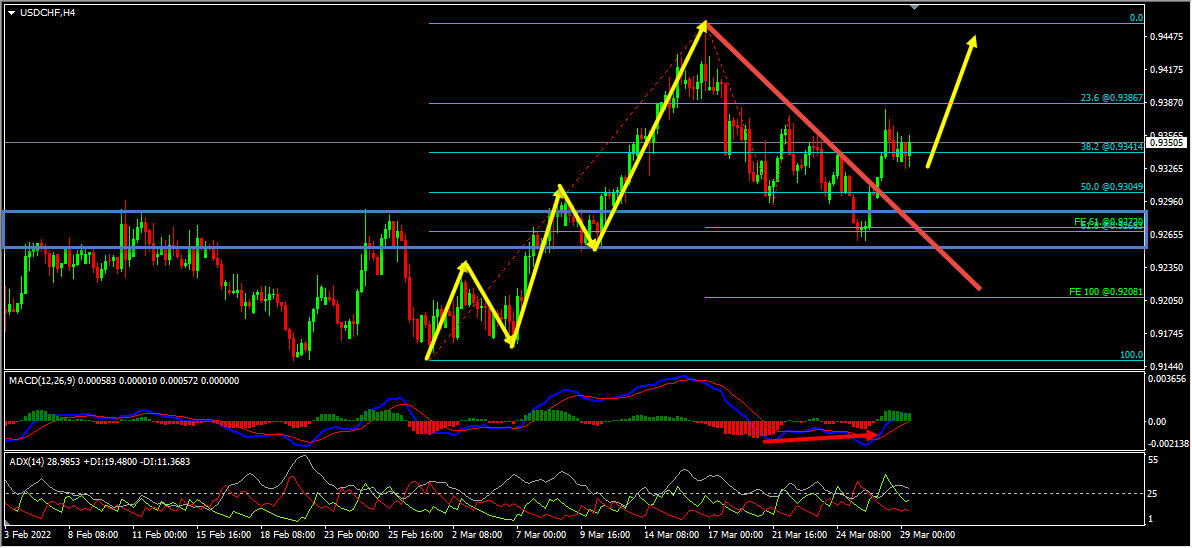
On the H4 chart, the price which was moving higher has created a bullish trend pattern in the form of three higher highs, higher lows, we may consider this as evidence of bullish pressure. Generally, after a bullish trend pattern, we may expect corrections and then potential continuation higher. Currently it looks like a correction has happened in the form of double wave to the downside. Also, the price which was moving lower reached a key support zone that has formed based on the 61.8%(0.92720) Fibonacci expansion level of the first wave of this correction and the 61.8%(0.92683) Fibonacci retracement level of the bullish trend pattern. The price respected this key support zone and is currently bouncing higher from this zone. In addition to this, we could see that the price which was moving lower created a bullish divergence that has formed between the first low that has formed at 0.92953 and the second low that has formed at 0.92603 based on the MACD indicator. Also, the price which is moving higher has broken above the most recent downtrend line, we may consider these as other evidences of bullish pressure. In addition to this, the ADX indicator gave a bullish signal here at the cross of +DI (green line) versus -DI (red line) and the main signal line (silver line) reads value over 25, we may consider this as yet another evidence of bullish pressure. Until the key support zone holds my short term view here is bullish and I expect the price to move higher further.
(Note: You can learn about a Killer Forex Strategy “Double Trend Line Principle” here)
It is always recommended to look for confirmations before you jump into any trade. If you are not sure about how to trade this short term buy setup then you can use any setup and strategy that you have in your arsenal to look for bullish moves and join this buy trade.
Also, don’t forget to protect your buy trade using a stop loss and make sure to set a target and keep a proper risk/reward ratio.
You will also find a pretty extensive database of educational materials here in the blog – just use the search or check out the Forex Education section above.
Not sure how to enter a trade? Spot reversals (bounces)? Not sure how to spot breakouts?
I invite you to
And improve your trading with us.
Also, you can get one of our strategies free of charge. You will find all the details here
If you have any further questions, don’t hesitate to drop a comment below!
Happy Trading!
Arvinth Akash
Traders Academy Club Team
GDP growth is one of the most important indicators of economic health. But does stronger…
When it comes to fundamental Forex analysis, few institutions matter as much as the Federal…
Interest rates are one of the most important fundamental forces in the Forex market. But…
The latest U.S. employment report has delivered a significant warning for the market. With only…
The Forex market does not always offer clear trading opportunities. Sometimes, price moves sharply in…
Open social media for a few minutes and you can easily find someone talking about…
View Comments
After the formation of Bearish Engulfing candle I expect a deeper pullback.
That how I see it.
Thanks
Ansar