Hi Traders! AUDNZD short term forecast and technical analysis post is here. The way I would like to analyze the chart for setups is based on multi-timeframe confirmations because in my POV if we get more evidences on different timeframes for the same direction then it makes the setup much more reliable. If you would like to learn more about the way we trade and the technical analysis we use then check out the Traders Academy Club Spoiler alert – free memberships are available! Let’s start our analysis from the highest timeframe which will be the daily chart here.
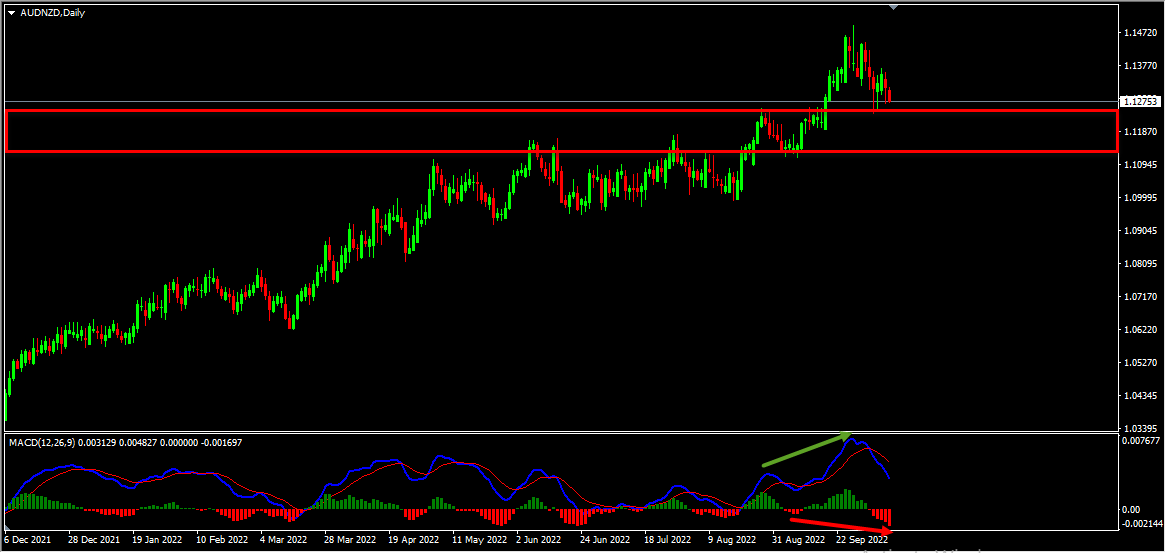
On the daily chart, we had a strong resistance zone and the price which is moving higher has currently broken above this zone and is holding above it, we may consider this as evidence of bullish pressure. Also, the price which is moving higher has broken above the last high and has created higher highs based on the MACD indicator which is a sign of gaining momentum towards the bullish side. Currently, it looks like a pullback is happening with the price creating a bullish hidden divergence that has formed between the first low that has formed at 1.11146 and the second low that has formed at 1.12452 based on the MACD indicator which we may consider as evidence of bullish pressure. Also, currently there are no signs opposing this short term bullish view. We may now move down to lower timeframe and see if we can find evidences supporting this short term bullish view.
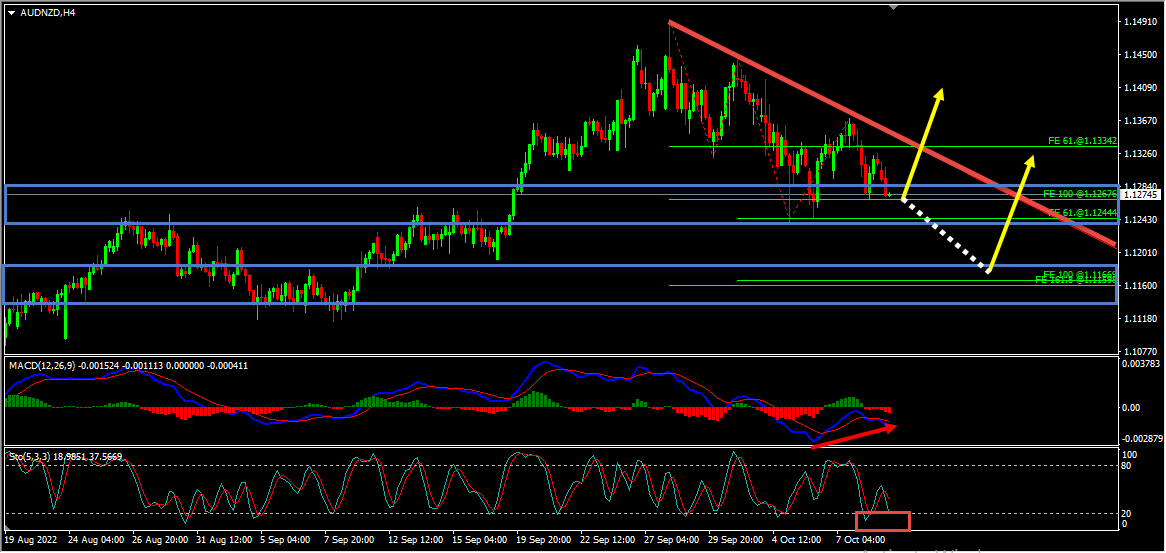
Looking at the H4 chart, currently it looks like a correction is happening. Also, while measuring the legs, we have two key support zones that has formed. The first key support zone is formed based on the 100%(1.12676) Fibonacci expansion level of the first wave and the 61.8%(1.12444) Fibonacci expansion level of the second wave. The second key support zone is formed based on the 161.8%(1.11666) Fibonacci expansion level of the first wave the 100%(1.11598) Fibonacci expansion level of the second wave. The price which was moving lower, has currently reached the first key support zone. Also, we have a potential bullish divergence that is forming at the moment which we may consider as evidence of bullish pressure. In addition to this, based on the Stochastic Oscillator we could see that the price has reached its extreme, which we may consider as yet another evidence of bullish pressure. So based on all this, until the key support zones hold my short term view remains bullish here. A valid breakout above the most recent downtrend line would be the validation for this bullish view.
It is always recommended to look for confirmations before you jump into any trade. If you are not sure about how to trade this short term buy setup then you can use any setup and strategy that you have in your arsenal to look for bullish moves and join this buy trade.
Also, don’t forget to protect your buy trade using a stop loss and make sure to set a target and keep a proper risk/reward ratio.
You will also find a pretty extensive database of educational materials here in the blog – just use the search or check out the Forex Education section above.
Not sure how to enter a trade? Spot reversals (bounces)? Not sure how to spot breakouts?
I invite you to
And improve your trading with us.
Also, you can get one of our strategies free of charge. You will find all the details here
If you have any further questions, don’t hesitate to drop a comment below!
Happy Trading!
Arvinth Akash
Traders Academy Club Team
When it comes to fundamental Forex analysis, few institutions matter as much as the Federal…
Interest rates are one of the most important fundamental forces in the Forex market. But…
The latest U.S. employment report has delivered a significant warning for the market. With only…
The Forex market does not always offer clear trading opportunities. Sometimes, price moves sharply in…
Open social media for a few minutes and you can easily find someone talking about…
EURUSD, GBPUSD, USDJPY, Gold and Bitcoin remain at important technical levels as volatility and geopolitical…