
Hi Traders, US Session technical analysis March 20th is here. The week has just started and its time to analyze and find out the best trade setups that market has created for us. My analysis of some of the important currency pairs are as follows:
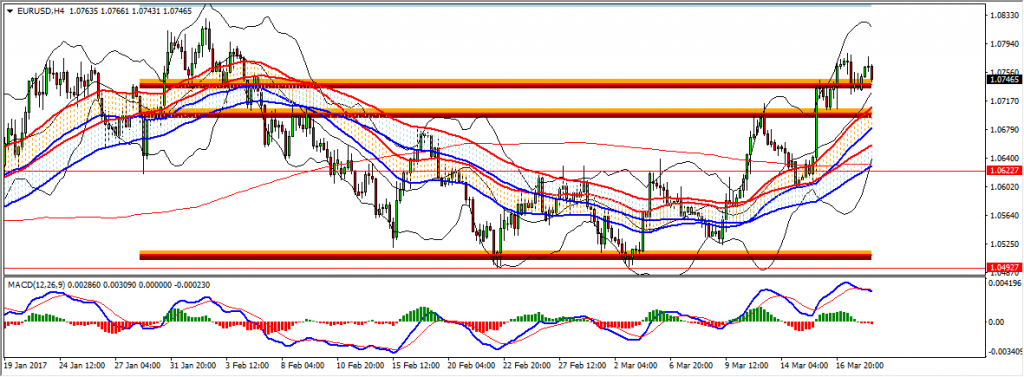
EURUSD H4 Chart:
The price is in a key level 1.073 at the moment. The triple cycle which started at the beginning of March might be at its end as a regular bearish divergence occurred which confirms the loss of momentum hence we can expect a reversal and we might expect the cycle to reach the 50% retracement of the entire cycle. Hence the price might to reach below the 1.069 support area.
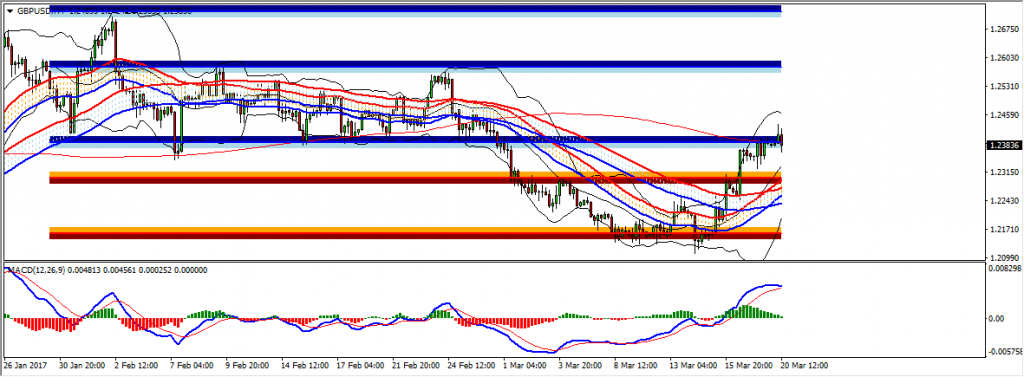
GBPUSD H4 Chart:
The bullish cycle which started in the mid of march is still continuing The price which was at the support zone 1.229 has now reached the 1.239 resistance area. We can expect the price to move higher and reach the resistance zone 1.239 until this momentum continues, a lose of momentum might result in the price to go below this area and reach the 1.229 support zone.
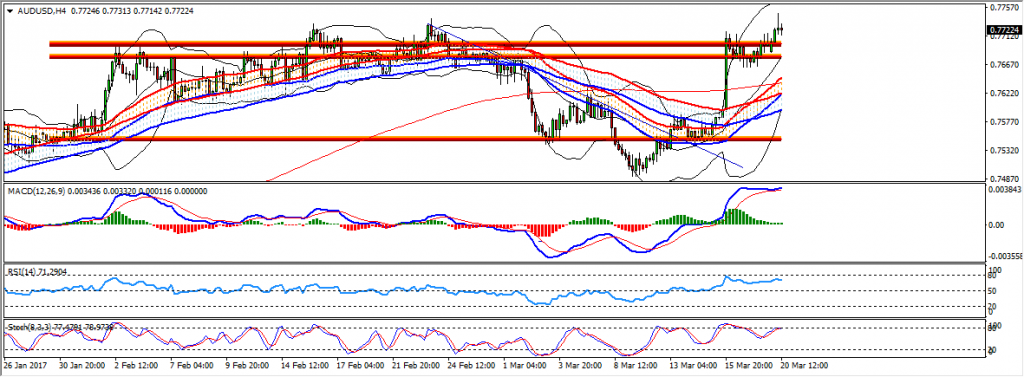
AUDUSD H4 Chart:
The price which was at the 0.769 key level has now moved above it after the correction. Because of the extreme divergence which occurred last week still there is a good possibility that the price might go below the 0.767 support level. However until we see a confirmation for a sell, the momentum is bullish and we might go after buys.
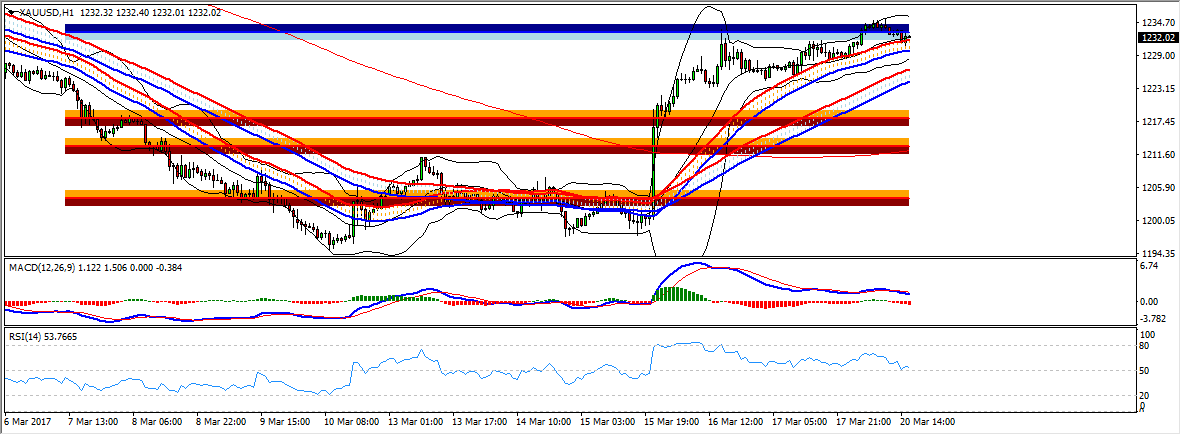
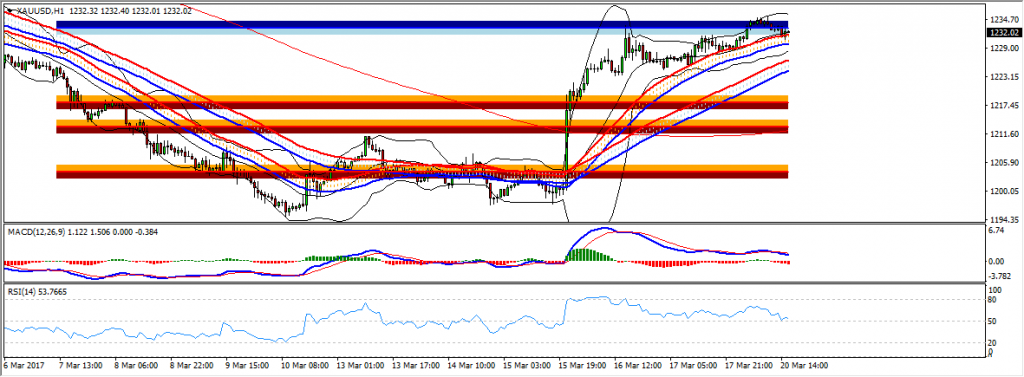
Gold H4 Chart:
The bullish momentum which caused by the news last week still continues and price has reached the strong resistance zone 1234. At the moment we can expect this momentum to continue and the price might move higher above the 1234 resistance level until a change of momentum happens.
You can get more trade ideas by joining my club for free now. You can enroll today using our Broker Sponsorship project here:
You can also get one of my strategies free of charge using the same Sponsorship project.
Yours,
Vladimir





Thank you Vlad. You are doing a great job